
Wall Street extended gains for a second session as Nvidia’s upbeat revenue forecast revived confidence in the AI trade. The Nasdaq 100 led the rebound, while the S&P 500 and Dow Jones erased earlier tariff-driven losses.
Momentum is clearly pointing higher in the near term. However, thinning futures volume and major psychological levels overhead suggest this may not be a straightforward break to fresh highs.
Positioning data from the COT report remains supportive, and seasonality tends to favour US equities from March onwards. That combination points to limited downside — but also hints that Wall Street may remain rangebound unless a fresh catalyst emerges.
View related analysis:
- Nasdaq 100 Technical Analysis: Seasonal Weakness Meets Key Support
- Bitcoin Outlook: Is 60k the Bounce Zone or a Trap Door to 50k?
- Nasdaq 100 Outlook: Earnings Strength Meets Technical Resistance
- Gold Price Outlook: Are Options Traders Front-Running a Breakout?
Can Nvidia Momentum Push the Nasdaq 100 and S&P 500 Through Resistance?
The key question now is whether this rebound has the fuel to break major resistance levels.
Futures volumes have been declining this week, which is not typically conducive to a sustained bullish breakout. That divergence between rising prices and falling participation suggests buyers may be less aggressive than the headlines imply.
S&P 500 futures traders are watching 7,000, while the Nasdaq faces a pivotal zone around 25,500–26,000. The Dow Jones still has the 50,000 milestone overhead — and without a fresh catalyst, those levels may prove sticky.
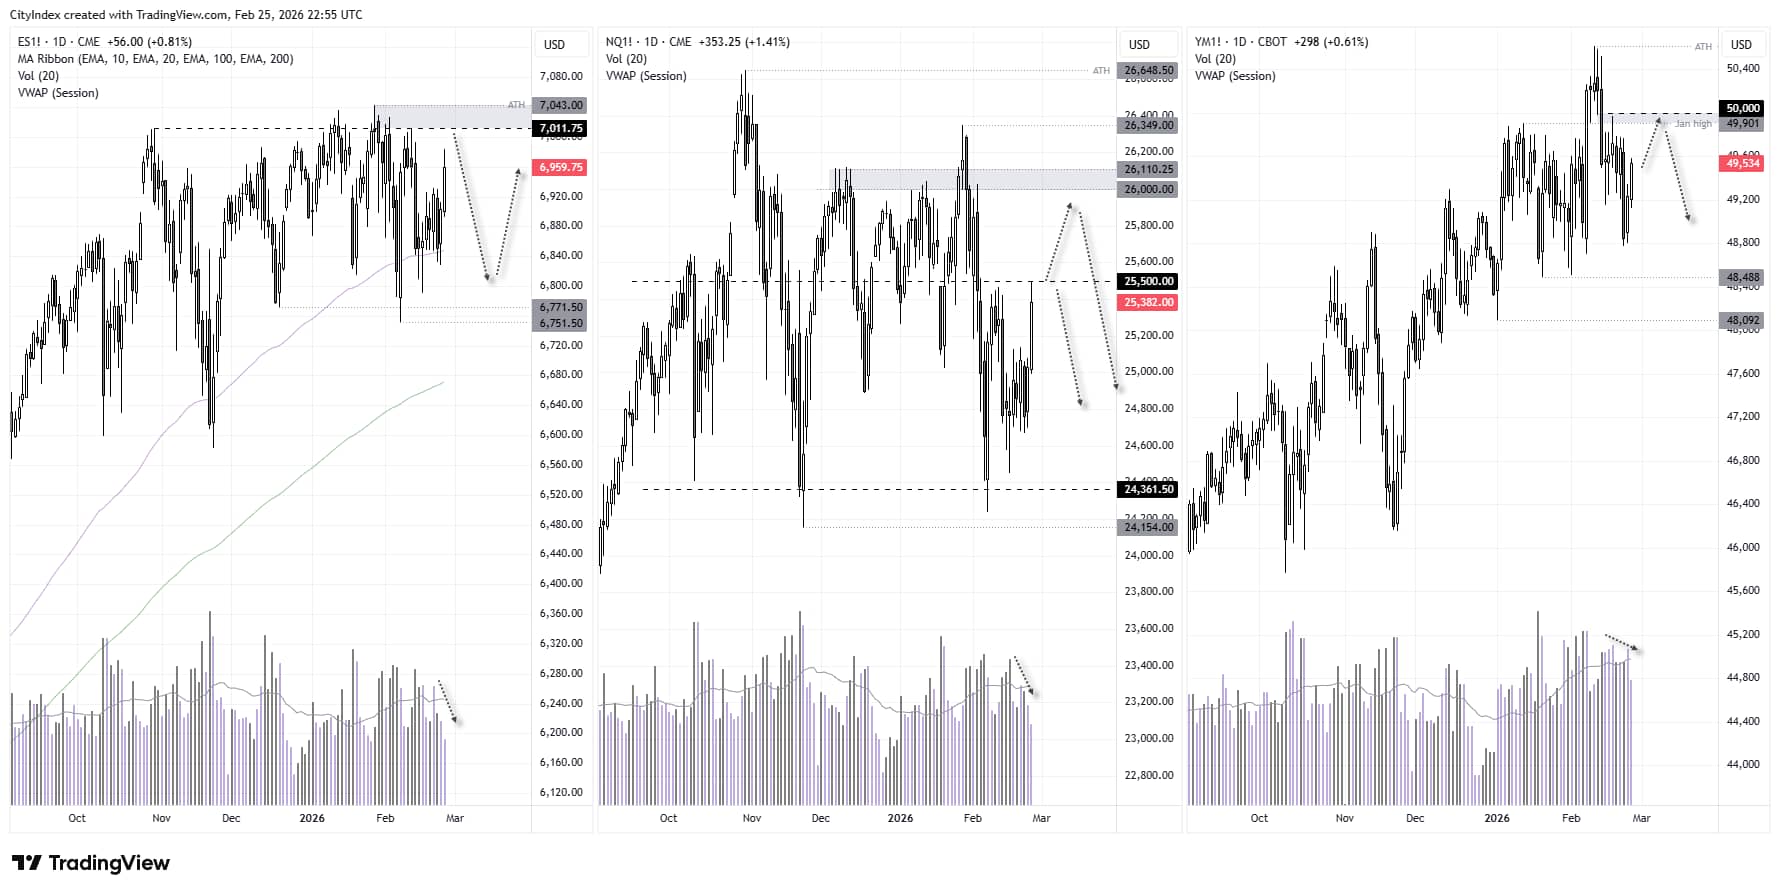
Source: CME, CBOT, TradingView

Wall Street’s Pullback Could Be Limited, Looking at COT Report, Seasonality
COT Report: Asset Managers Add to S&P 500 and Nasdaq 100 Longs
The latest Commitment of Traders (COT) report shows asset managers increased their net-long exposure to S&P 500 futures to a 13-month high, and to a three-week high on Nasdaq 100 futures. The S&P 500 retains the clearer bullish edge, given the notable rise in gross longs and the relatively low level of shorts.
At the same time, it is difficult to build a compelling case for shorting the Nasdaq based on asset managers’ futures exposure. Unless a clear bearish catalyst emerges, positioning suggests any pullback could be limited.
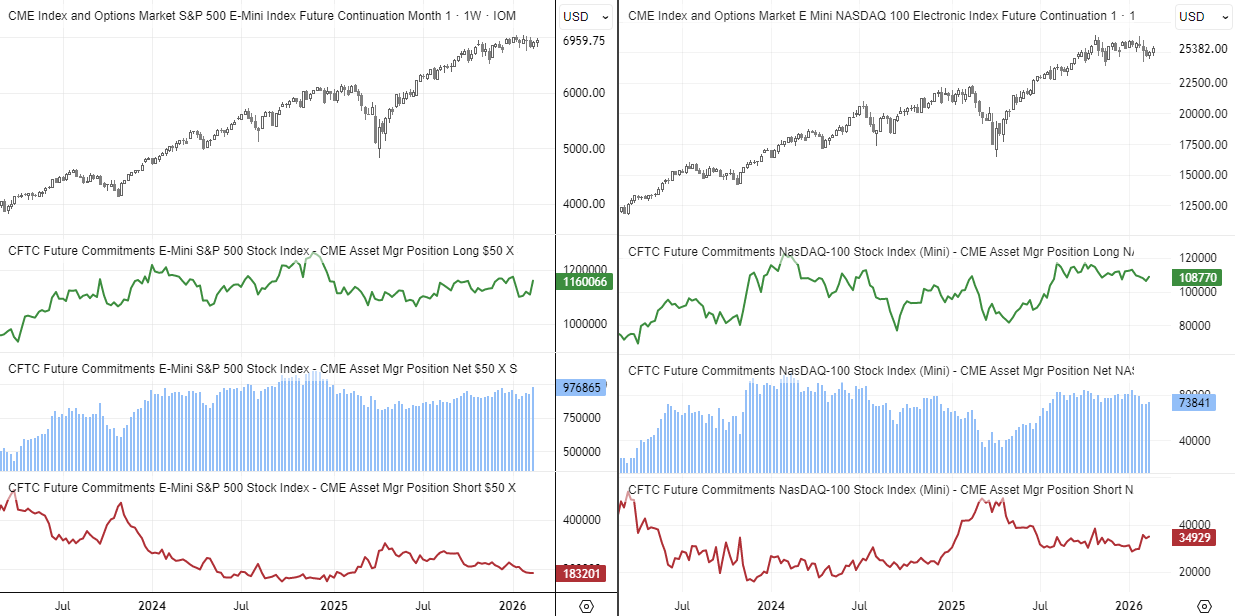
Source: CFTC (COT), CME, LSEG
Nasdaq 100 Seasonality: Weak February, Stronger March–August Bias
The Nasdaq 100 is on track for a marginally bearish month — which is not especially concerning given February is one of only two months with negative average returns and a win rate below 50%. Its average February decline over the past 25 years is around 5%, meaning this year’s performance has been relatively resilient by historical standards.
More importantly, seasonality tends to favour US equities from March through to August. When combined with bullish positioning among institutional traders, it supports the view that any Wall Street pullback could be limited in the broader scheme of things. I also suspect the Nasdaq and its peers will push to fresh highs later in the year.
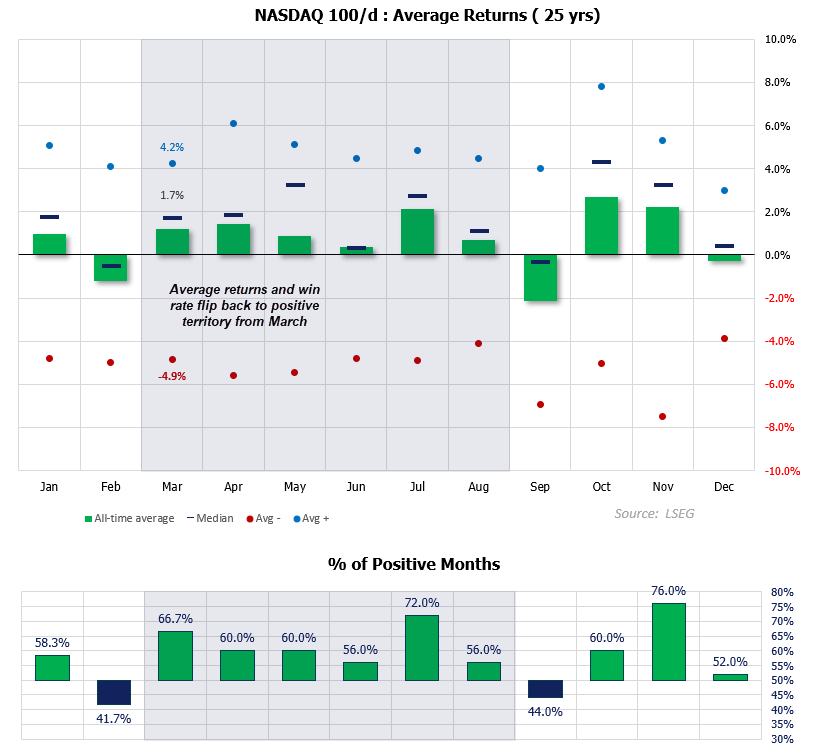
Source: NASDAQ, LSEG
Nvidia Earnings: AI Boom Intact, But Competition Rising
Nvidia forecast first-quarter revenue of around $78 billion (±2%), comfortably above the $72.6 billion expected, reinforcing the view that AI spending from Big Tech remains alive and well.
For retail traders, the message is clear: AI capex is still flowing, but rising competition from AMD and in-house chip development at Microsoft and Google means Nvidia’s dominance can’t be taken for granted — great for momentum, but not a one-way bet forever.

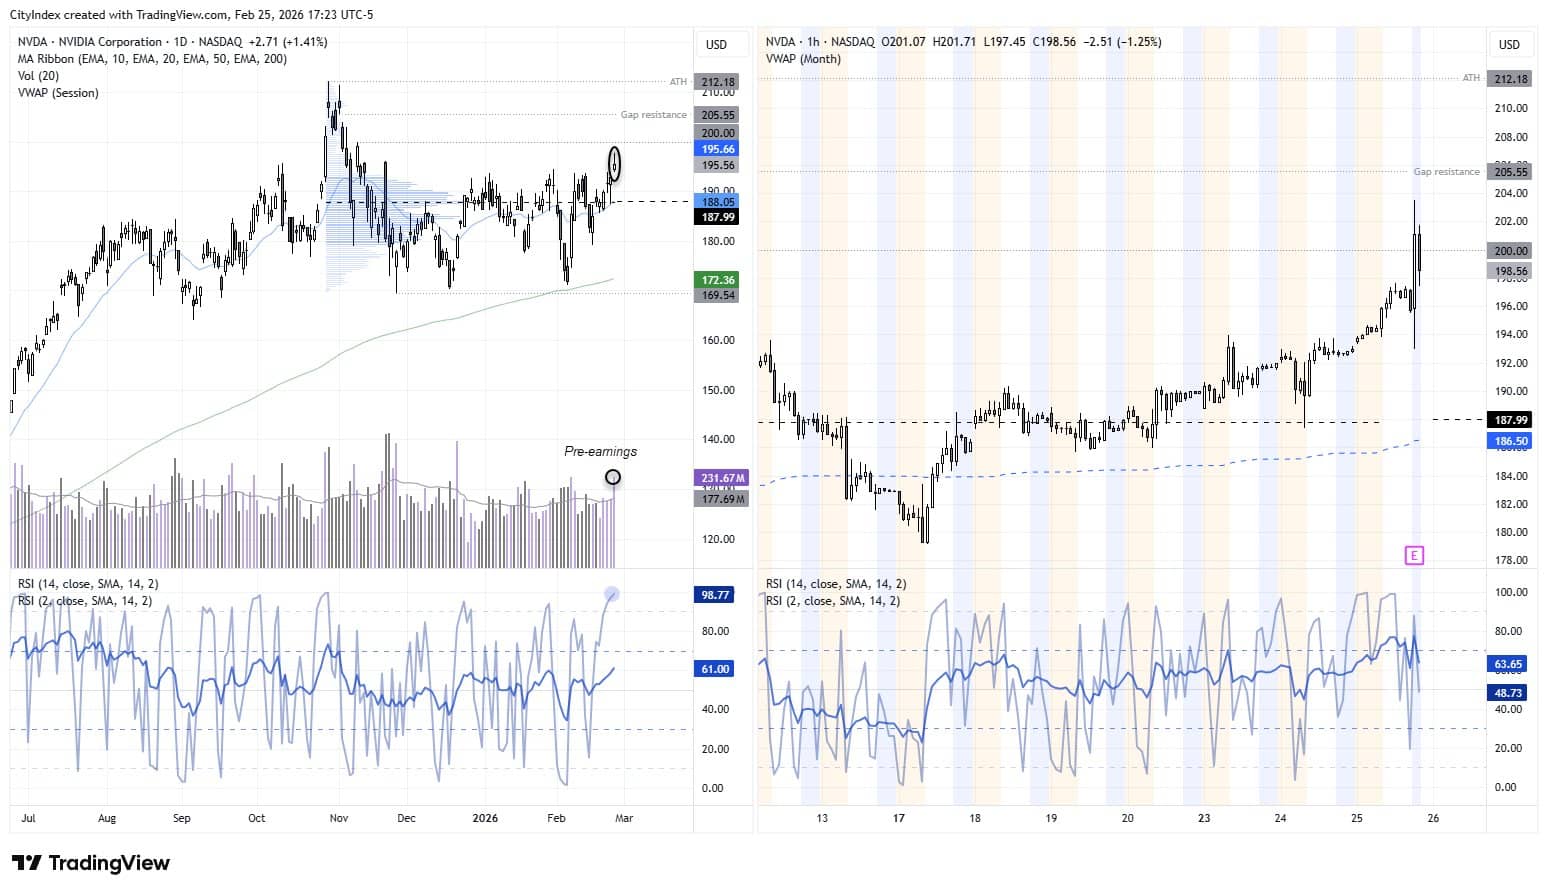
Nvidia (NVDA) Technical Analysis
The risk-on tone across Wall Street on Wednesday helped Nvidia’s share price reach its highest level since November ahead of the earnings release. Trading volumes were also above average to suggest initiative buying from bulls.
While NVDA rose as much as 3.5% after the market close, already its bullish momentum is waning. Prices are back below 200 at the time of writing, after a failed ‘bid’ to close to close the window on gap resistance at 205.55.
Ultimately, I remain doubtful that NVDA will simply break to new highs from here, and bears may be lurking around 206 and 210 in hoping of fading a false rally.
 View the full economic calendar
-- Written by Matt Simpson
Follow Matt on Twitter @cLeverEdge
How to trade with City Index
You can trade with City Index by following these four easy steps:
- Open an account, or log in if you’re already a customer
• Open an account in the UK
• Open an account in Australia
• Open an account in Singapore
- Search for the market you want to trade in our award-winning platform
- Choose your position and size, and your stop and limit levels
- Place the trade