
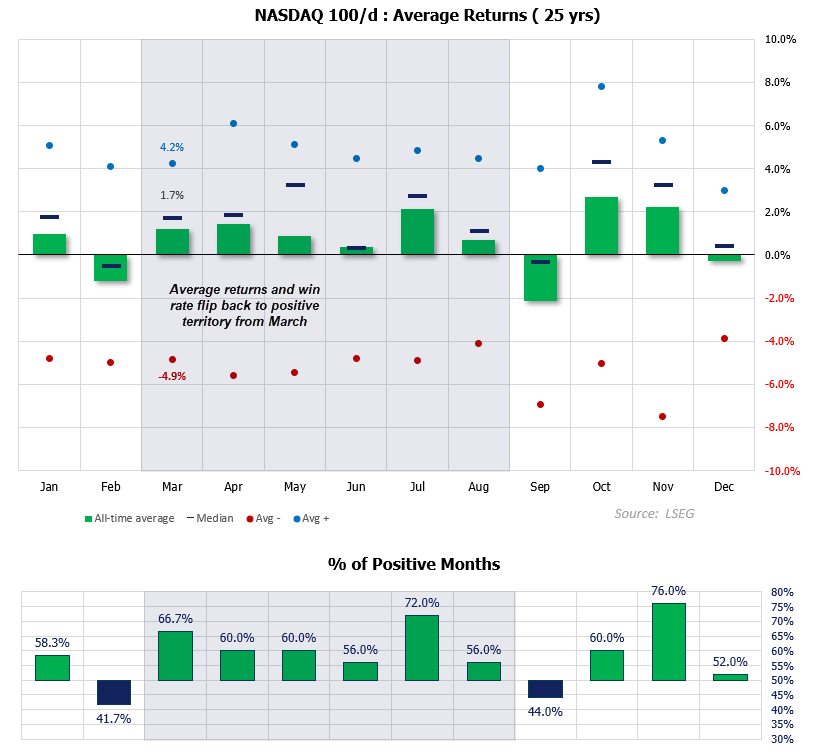
The Nasdaq 100 is down -3.3%, but context matters. February is one of only two months that typically delivers negative average returns for the Nasdaq 100 and Wall Street more broadly. The average down month for the index is around -5%, so the current pullback remains modest by historical standards.
View related analysis:
- Nasdaq 100 Leads Risk-Off as Tech Earnings Weigh, Gold Slides
- Nasdaq 100 Outlook: Earnings Strength Meets Technical Resistance
- Gold Price Outlook: Options Sentiment Extreme as Bears Target 4800
- FX Futures Positioning: USD, EUR, GBP, CAD | COT report
- ASX 200 Market Outlook: 9000 Becomes Key Battleground
Considering tech stocks rallied more than 55% from the April low to the October record high, this retracement looks more like digestion than deterioration.
Seasonality improves from March, when average and median returns flip back into positive territory with a 66.7% win rate. With asset managers still net-long Nasdaq futures and positioning far from an extreme, this appears to be a natural correction within a strong uptrend — one that could ultimately pave the way for fresh highs in the months ahead.
Source: CME, LSEG
Nasdaq 100 Technical Analysis: Key Levels and Seasonality in Focus
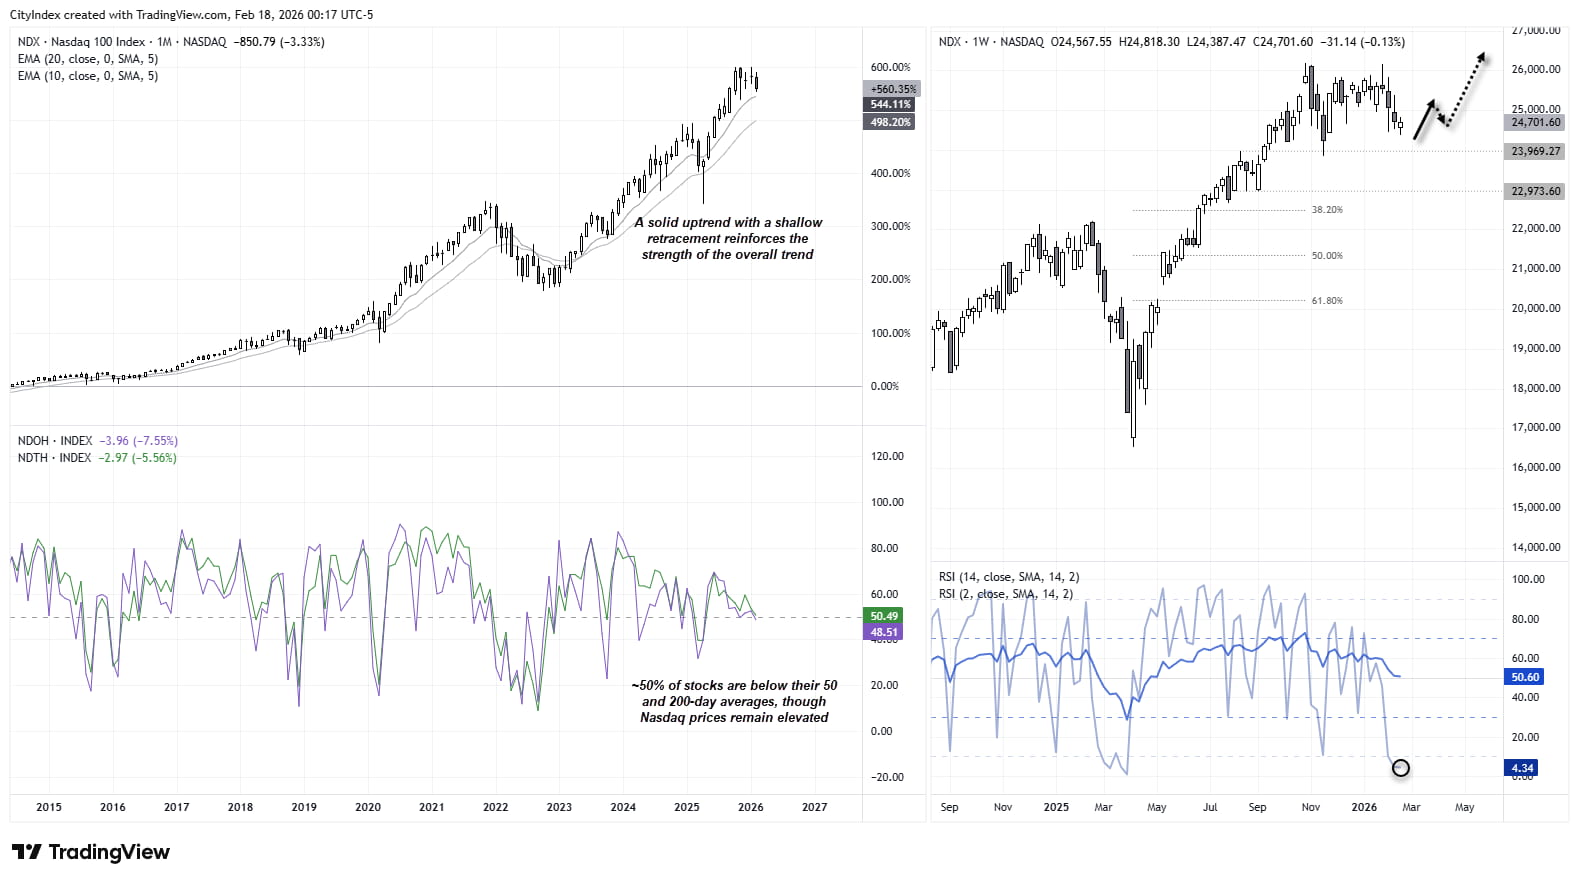
Nasdaq 100 Futures (NQ) – Monthly and Weekly Charts
The monthly chart (left) shows the Nasdaq 100 remains in a solid uptrend, and even with this month’s losses the retracement appears relatively shallow. Earnings season failed to deliver the disappointment I had anticipated, which has helped cap downside potential for bears.
It is also worth noting that the percentage of stocks trading above their 50-day and 200-day moving averages is hovering around 50%. That is not particularly compelling for either bulls or bears. However, given the modest pullback, you could argue this breadth reading is consistent with a controlled correction rather than the start of a broader downturn.
The weekly chart (right) shows downside momentum is beginning to wane after a three-week selloff. Even if another leg lower unfolds, the 24,000 level appears pivotal, where bulls may attempt to step back in.
Source: CME, TradingView

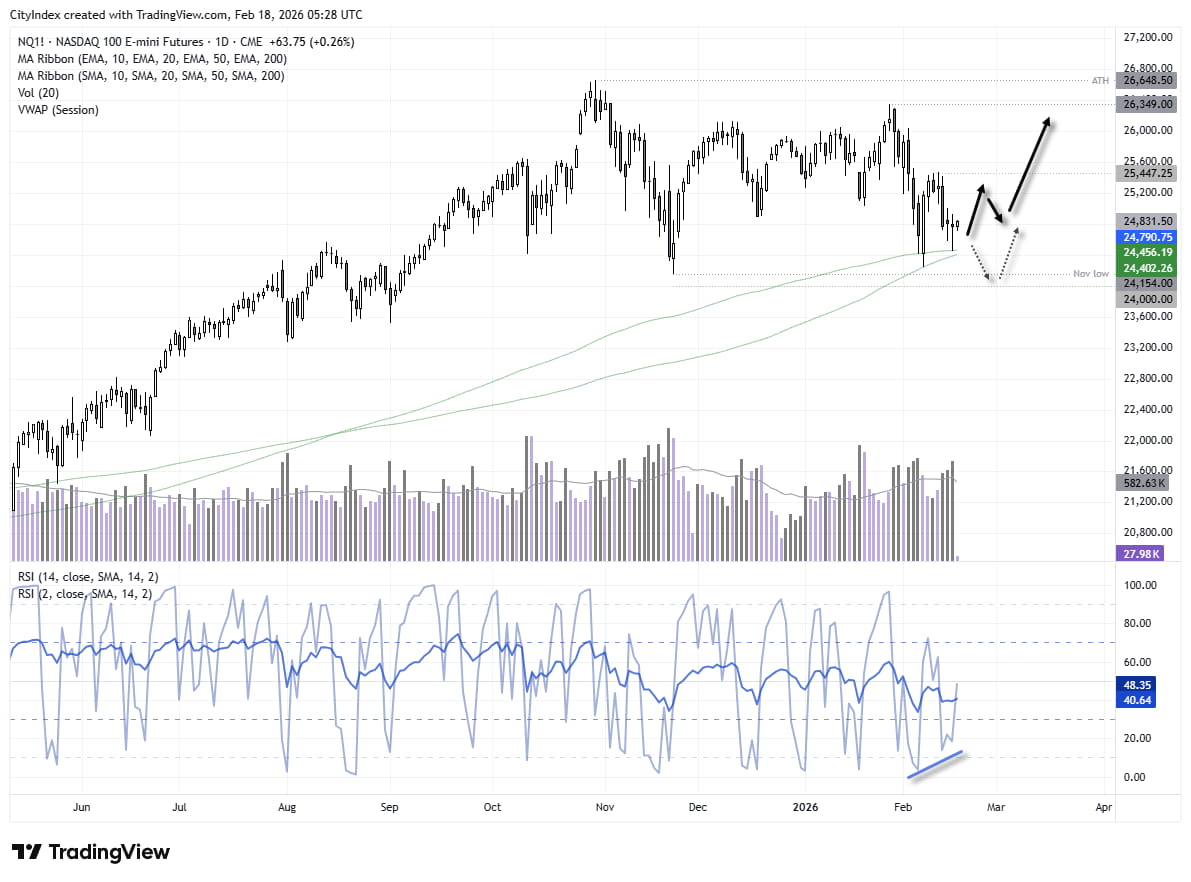
Nasdaq 100 Futures (NQ) – Daily Chart Outlook
I suspect the Nasdaq 100 may have printed a swing low – or is at least close to doing so. Despite falling for three consecutive days on rising volume, the lower wick and diminishing daily range hint at a potential shift from bears to bulls. Importantly, today’s low respected the 200-day moving average, and the prior selloff also failed to decisively break these long-term MAs.
With bullish RSI divergences in play and a series of higher lows above the November trough, bulls may attempt to reclaim 25,000 and retest last week’s high around 25,447.
Still, with the potential for choppy trade into month-end, another dip cannot be ruled out. However, the bias favours bulls stepping in while prices hold above 24,000. And with seasonality turning more supportive from March, the Nasdaq 100 could yet make another attempt at record highs.
Source: CME, TradingView
View the full economic calendar-- Written by Matt Simpson
Follow Matt on Twitter @cLeverEdge
How to trade with City Index
You can trade with City Index by following these four easy steps:
- Open an account, or log in if you’re already a customer
• Open an account in the UK
• Open an account in Australia
• Open an account in Singapore
- Search for the market you want to trade in our award-winning platform
- Choose your position and size, and your stop and limit levels
- Place the trade