
NFP, war sentiment, and oil risks are pressuring US indices toward bearish territory, as stagflation risks build amid sharp energy price surges and a lack of near-term resolution between the US and Iran. Strong NFP data at 178K highlights labor market resilience, but geopolitical risks remain the dominant driver.
Liberation Day Comparisons
“Liberation Day” comparisons are resurfacing, echoing the April 2025 drawdowns. However, unlike last year, a single speech from Trump is unlikely to shift sentiment meaningfully. Market focus has shifted toward Iran, given its influence over Middle East developments and the Strait of Hormuz, a key artery for global energy flows. This dynamic is feeding inflation through rising commodity prices, fertilizer costs, and insurance premiums.
Heightened headline sensitivity is also exposing markets to sharp volatility swings, with markets moving 500–1000 points within a single session. This environment increases the risk of both bullish and bearish positions being stopped out, and market traps, particularly when positioning is not aligned with broader trend and volatility conditions.
Such volatility underscores the importance of aligning trading strategies with higher time frame levels, portfolio diversification, and disciplined position sizing that accounts for wider stop ranges.
The Coming Two to Three Weeks
The coming two to three weeks may bring further disruptions, as ongoing strikes target critical oil and gas infrastructure across the Middle East, extending to desalination plants, steel and aluminum facilities, and key logistics routes. These developments complicate the path toward regional stability and highlight the time required to restore damaged infrastructure even in the event of a ceasefire.
Markets remain in a holding pattern, awaiting clarity on a potential resolution, while conflicting narratives between the US and Iran continue to drive uncertainty. Downtrends extending from the March 2026 highs remain in focus despite intermittent sentiment-driven rallies.
The latest NFP report surprised to the upside at 178K
The latest Non-Farm Payrolls report surprised to the upside at 178K, signaling resilience in the US labor market despite ongoing geopolitical tensions. However, market reaction remains limited, as Middle East developments and energy prices continue to outweigh macroeconomic data, reinforcing the current disconnect between potentially lagging economic indicators and market pricing.
Economic data will still play a key role in determining whether current risks translate into slower growth and higher inflation, reinforcing global risk-off conditions, or whether markets continue to absorb these risks as part of broader expectations.
Key Levels to Watch Confirming Extended Downtrends
• DXY: breakout above 100.60
• Nasdaq: break below 22,800
• Dow Jones: break below 44,900
• Crude oil: breakout above 118 (Q2 2026 Outlook)
Nasdaq Outlook: Weekly Time Frame – Log Scale
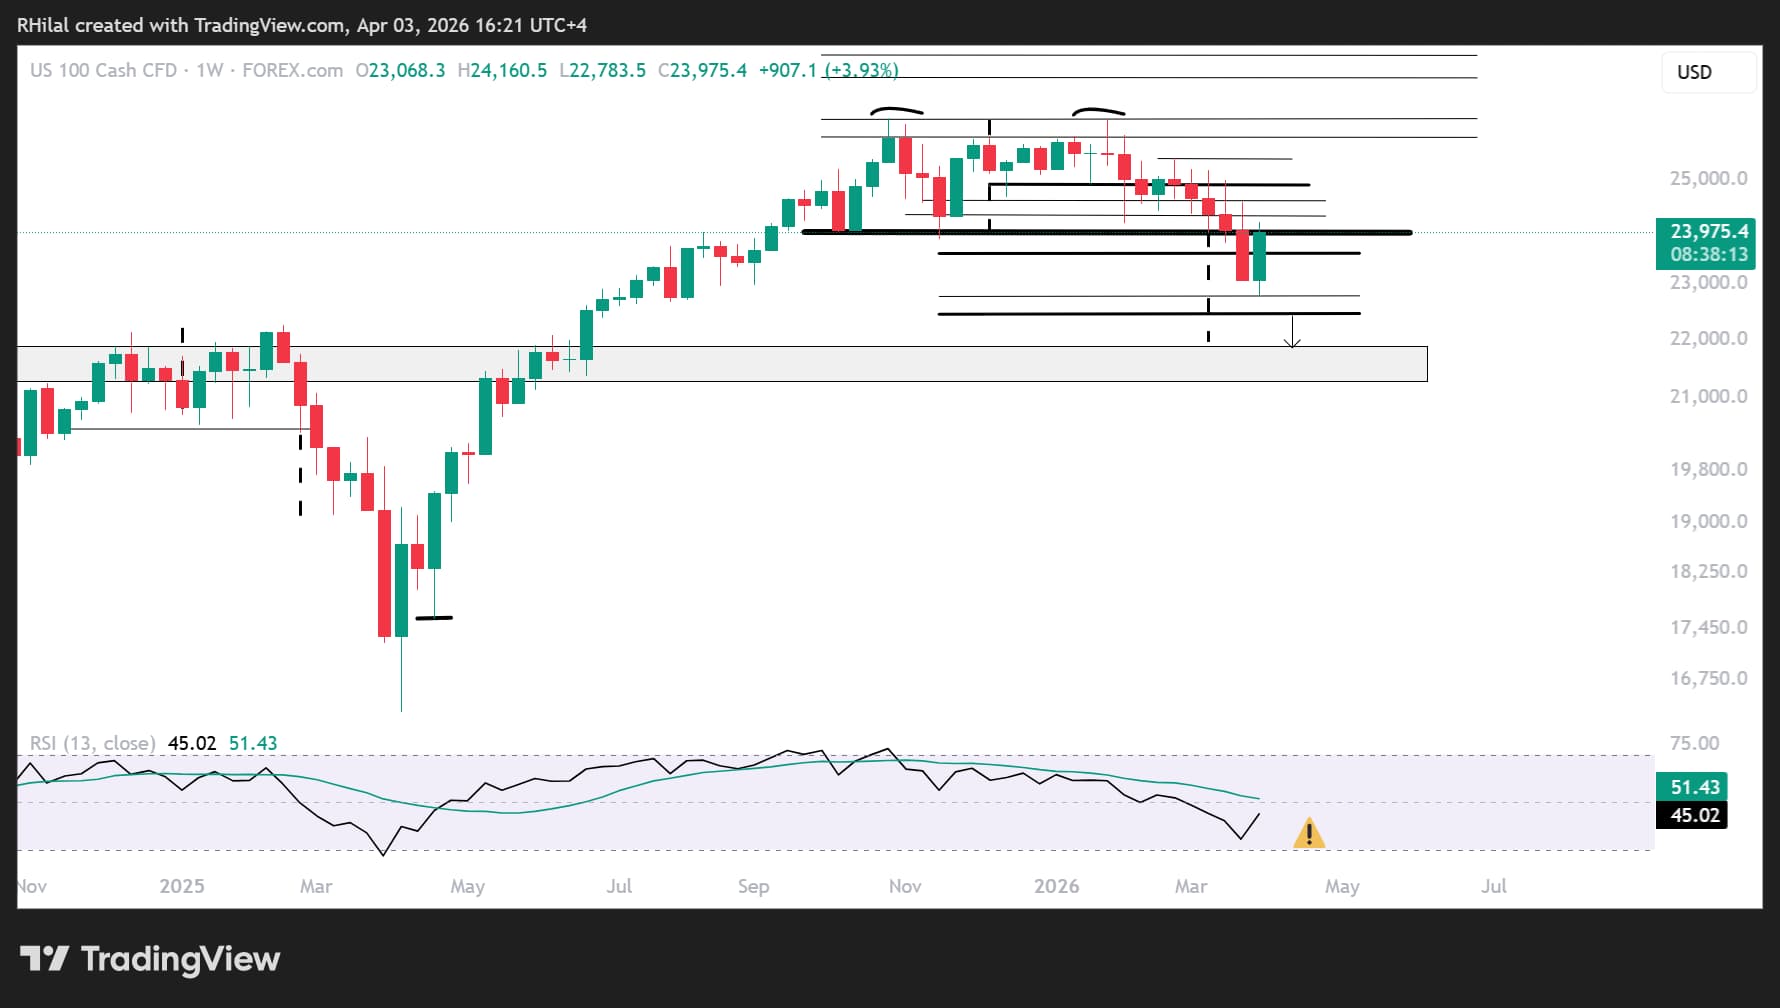
Source: Trading View
The Nasdaq weekly chart continues to trace a double top formation extending from the 2025 highs. The neckline remains near the 24,000 level, where price action is currently stabilizing amid fluctuating sentiment between policy expectations and ongoing Middle East risks.
Bullish Scenario:
A close above 24,000 would invalidate the double top scenario, opening the path toward resistance levels at 24,600, 25,200, and 25,800. A sustained move above 25,800 would reinforce longer-term bullish breakout potential toward 26,300 and 27,000.
Bearish Scenario:
On the downside, failure to reclaim the 24,000 neckline keeps drawdown risks in focus, with support levels at 23,500 and 22,900. A break below these levels would expose deeper downside toward the 2024 highs near 22,100 and 21,800.
Dow Jones Price Outlook: Monthly Time Frame – Log Scale
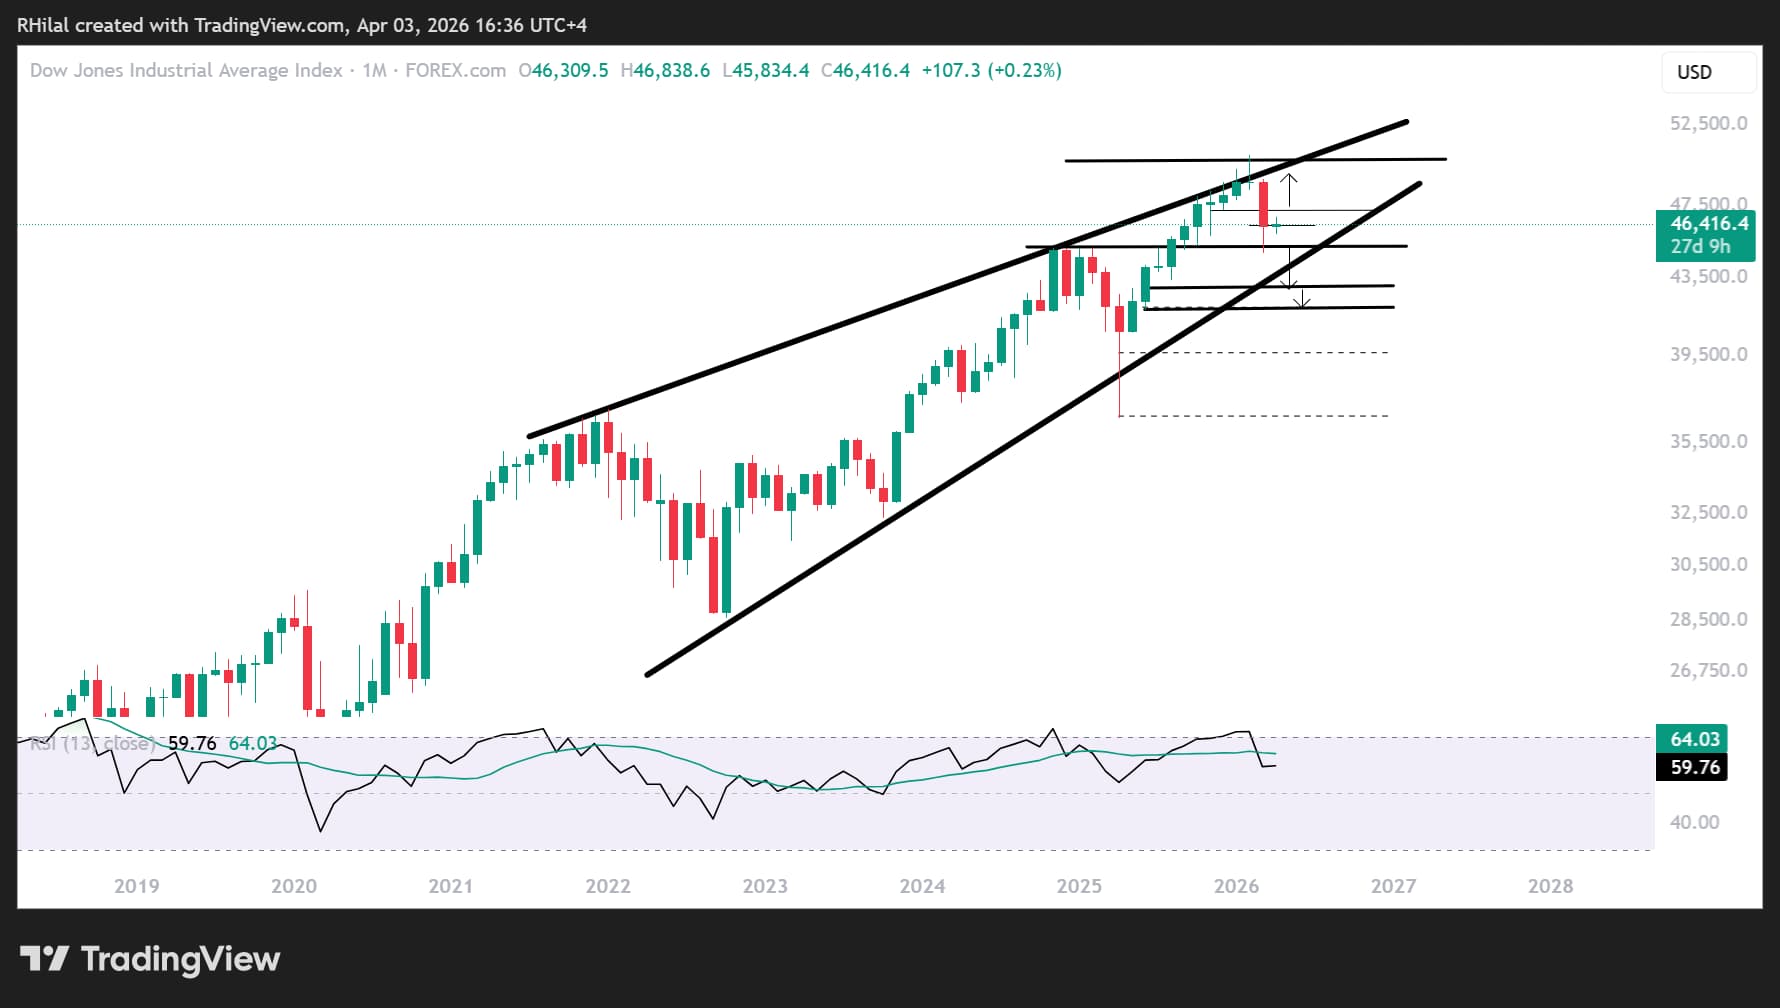
Source: Trading View
The Dow Jones monthly chart remains a key driver of broader bearish expectations across US indices. Price action is consolidating within a diagonal formation following the rebound from the 2020 lows.
Bearish Scenario:
The 2026 lows have rebounded from the 2024 highs near the 44,900 level, which remains a critical support. A break below this level would expose the lower bound of the formation near 43,000, followed by support at 41,800. Further downside could extend toward the April 2025 lows near 39,000 and 36,000.
Diagonal formations are typically associated with sharp corrective moves, reinforcing risk-off sentiment amid ongoing geopolitical tensions.
Bullish Scenario:
On the upside, a close above 47,000 would support a recovery toward the upper bound of the formation, with targets at 48,200, 48,800, and potentially a retest of the 50,000 level for another breakout attempt.
Written by Razan Hilal, CMT
Follow on X: @Rh_waves