


Asian indices surged on Tuesday as optimism grew that trade tensions between the US and China are thawing. Donald Trump said he expected a fair deal with China and played down concerns over potential friction with Xi Jinping on Taiwan ahead of their meeting. The Nikkei reached a record 50,000, while the Nasdaq 100 hovers near its all-time high, hinting at renewed global risk appetite.
View related analysis:
- Nasdaq 100, S&P 500, Dow Jones Outlook: Has The Dead Cat Bounced?
- Nasdaq, Crude Oil Plunge Amid Trump-Tariff Revival as Gold Holds Firm
- ASX 200 Morning Market Outlook: Financials Lead Gains as CBA Rebounds
- Australian Dollar Outlook: AUD/USD Bulls Reclaim 200-Day, US CPI Looms
Nikkei at 50k and Nasdaq Near Record Highs as Trade Optimism Grows
The thawing of trade tensions saw Asian indices rise on Tuesday ahead of the European open. Donald Trump said he expected a fair trade deal with China and downplayed concerns that he would clash with Xi Jinping over Taiwan during their upcoming meeting.
- The Nikkei reached a fresh record high, with futures rising above 50,000 for the first time on record.
- ASX 200 futures (SPI 200) are up 0.9% — their best day in four — and are also approaching a record high.
- Hang Seng futures gained 2.5% to trade at a six-day high.
- DAX futures are leading Europe higher ahead of the open, up 1.9% and already exceeding their 10-day ATR (average true range).
- US futures are yet to react, but with Nikkei futures so close to record highs, it’s hard to imagine they won’t be reached today — even if only briefly.
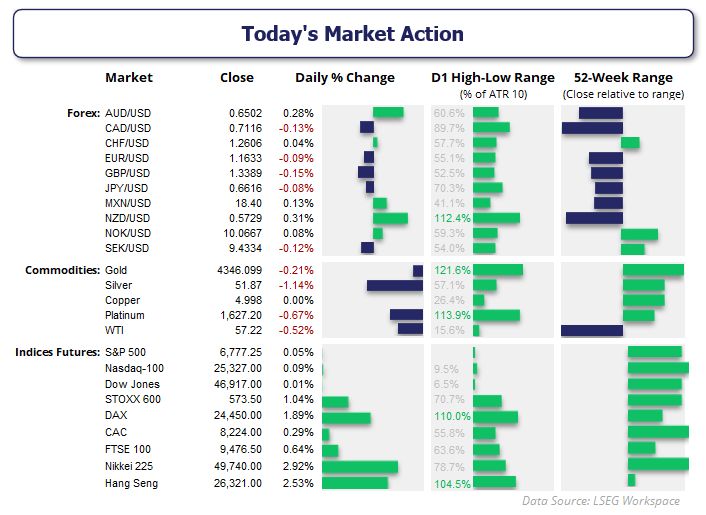
Chart prepared by Matt Simpson, Source: LSEG

Nikkei 225 Futures (NK), Hang Seng (HSI) Futures Technical Analysis
The daily chart shows Nikkei OSE futures briefly breaching the 50,000 level for the first time on record, although there was little follow-through during Asian trade. Still, the broader trend remains bullish, with Monday’s bullish engulfing candle paving the way for today’s milestone.
However, with hesitation to sustain gains above 50,000 and bearish divergences forming on both the RSI(14) and RSI(2), traders may need firmer evidence that trade tensions have truly eased before expecting a sustained breakout.
Hang Seng futures have broken above their 50-day EMA and sit at a six-day high. A bullish divergence in the oversold RSI(2) zone preceded the two-day rally, though further gains may prove limited. Bulls should note the high-volume node (HVN) just below the 27,000 handle, which could cap upside potential. The risk remains for another leg lower, assuming the correction unfolds in at least three waves.

Chart analysis by Matt Simpson - Source: TradingView, Nikkei Futures (NKD1!), Hang Seng Futures (HK1!)
Wall Street Futures Technical Analysis: S&P 500, Nasdaq 100, Dow Jones
During Friday’s Asian session, I outlined a bearish scenario for Wall Street indices, assuming momentum would turn lower in line with a classic ‘dead cat bounce’. While it looked promising early in the US session that momentum was about to truly turn lower, any victory for bears was short-lived. Not only did momentum quickly reverse higher, but all three Wall Street indices closed the week with bullish hammers above key support levels.

Chart analysis by Matt Simpson, Source: TradingView, CME E-mini Futures, S&P 500 (ES1!), NASDAQ 100 (NQ1!), Dow Jones (YM1!)
The S&P 500 futures contract formed its bullish hammer just above the August high, the Nasdaq 100 held above its August high and the prior Friday’s daily close (amid Trump’s tariff revival), while Dow Jones futures formed a hammer above their July high. To add salt to bearish wounds, all three indices extended higher on Monday and are now considering a break to fresh record highs heading into Tuesday’s cash open.
Of the three, the Nasdaq is clearly the leader as it trades within points of its all-time high. The S&P 500 is 114 points beneath its own, though the Dow jones is the laggard at around 40 points beneath its high. For it to be deemed a true breakout to Dow Theory enthusiasts, all three indices will need to break above their respective highs.

Nasdaq 100 Futures (NQ) Technical Analysis
The Nasdaq is so close to breaching its record high, it would be rude not to at this point. The price action that brought the Nasdaq here over the past two days looks constructive of an imminent breakout, though the fact that Monday’s rally occurred on notably thin volume is a slight concern. The ~22.5k contracts traded yesterday was roughly half of that seen during last Friday’s selloff (its most bearish day in six months), suggesting some caution among bulls despite the recovery.
However, the 4-hour chart shows volumes increased during the latest leg higher, coupled with high cumulative delta volume (bids minus asks), indicating bullish initiation even if overall volumes were lower.
I suspect we’ll see an obligatory break to a record high, though note the monthly R1 pivot (25,530) and weekly R2 (25,626) overhead as a potential resistance zone. A daily close above this zone would make me more confident that a breakout is genuine rather than a fakeout. Otherwise, the Nasdaq remains vulnerable to a shakeout around these cycle highs and a dip lower within its bullish channel.
If momentum turns lower, bears could target the 25k handle, the weekly pivot point (24,857), or the lower trend channel near the weekly S1 pivot.
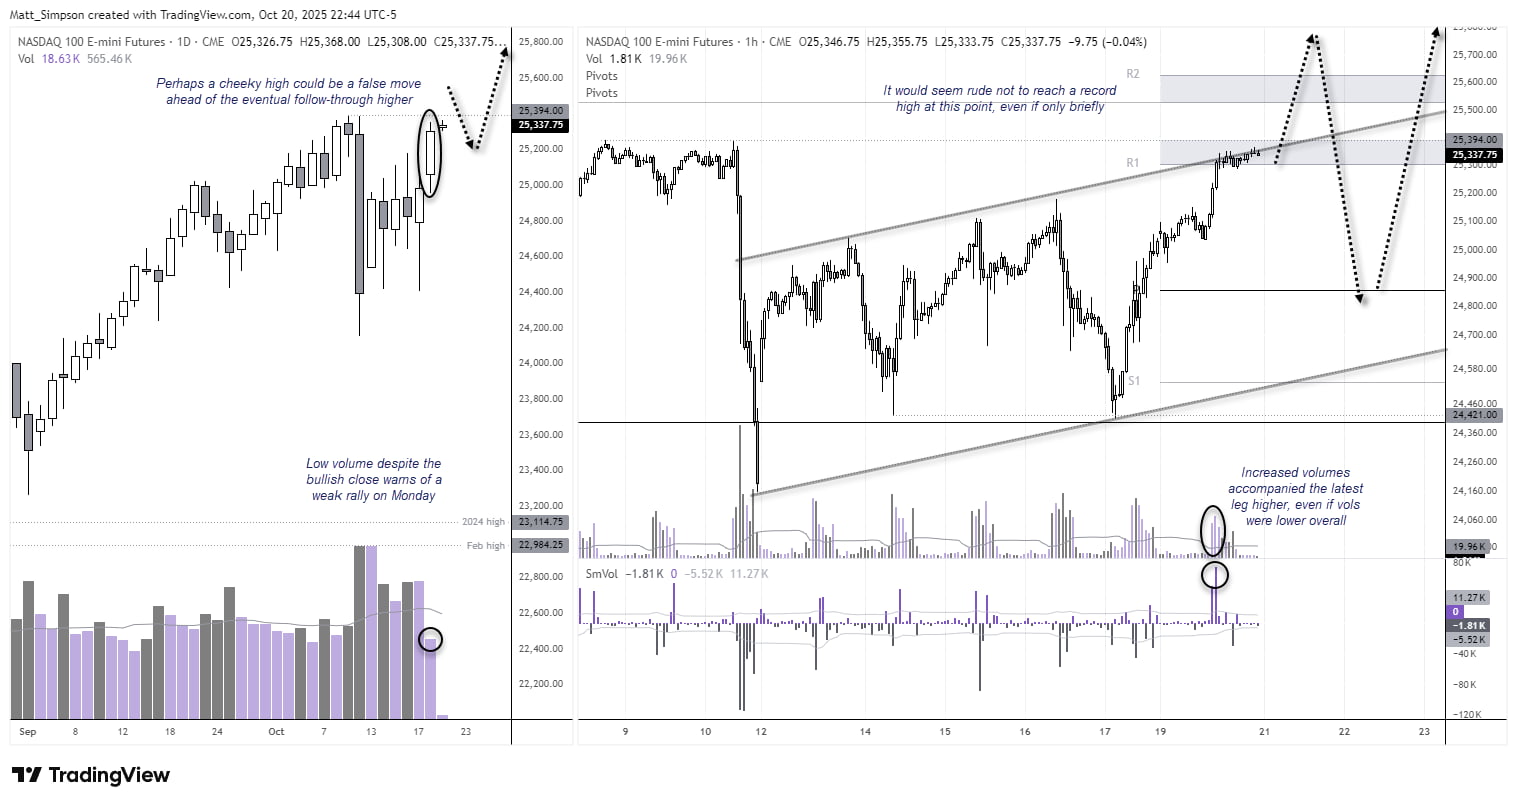
Chart analysis by Matt Simpson, Source: TradingView, CME Futures, NASDAQ 100 E-mini Futures
View the full economic calendar
-- Written by Matt Simpson
Follow Matt on Twitter @cLeverEdge
How to trade with City Index
You can trade with City Index by following these four easy steps:
- Open an account, or log in if you’re already a customer
• Open an account in the UK
• Open an account in Australia
• Open an account in Singapore
- Search for the market you want to trade in our award-winning platform
- Choose your position and size, and your stop and limit levels
- Place the trade


