


Using TradingView’s earnings-surprise metrics, Nvidia has beaten expectations in 30 of its past 31 releases. The lone miss in November 2022 came just a month after the October 2022 market low — and the stock has since rallied roughly 1,800%.
But concerns around valuation remain front and centre. Investors increasingly argue that AI-hardware growth is fully priced in, while hyperscalers may be nearing a pause after massive capex cycles. Microsoft and Nvidia have poured vast sums into AI infrastructure, yet the rapid rise of cheaper and open-source AI alternatives is making it harder to justify Nvidia’s runaway multiple. If the market’s favourite momentum engine finally stumbles, it could trigger a wide-ranging de-risking across tech and the broader equity market.
View related analysis:
- Nasdaq 100 Lags Dow Jones: Divergent Signals Among Nvidia, Apple, Meta
- The stats are working against bitcoin bulls today
- ASX 200 Market Outlook: Tech Rout Deepens, Financials Slide, ANZ Reverses
- ASX 200 Slides Further as Tech, Discretionary and Real Estate Crack
Nvidia (NVDA) Technical Outlook: Weekly Chart Signals Rising Downside Risk
The weekly chart shows a bearish engulfing candle forming around 200 two weeks ago, just beneath its all-time high. It was the most volatile week in six months, volume expanded during the prior two bearish weeks, and a clear bearish divergence appeared on the weekly RSI (14). The character of the longer-term uptrend has shifted, and traders should be alert to the risk of a deeper pullback. Nvidia now needs to keep beating earnings expectations and convince investors that meaningful growth is still attainable later in the cycle, despite rising scepticism and cheaper competitors entering the market.

Chart analysis by Matt Simpson - data source: TradingView Nvidia (NVDA)

Nvidia (NVDA) Earnings Trends: How NVDA Typically Trades Around Results
The chart highlights Nvidia’s price behaviour around earnings, using NYSE data from LSEG back to 2015. It’s immediately clear that Thursday delivers the strongest and most volatile returns in the days surrounding the release.
Remember: T0 captures the period after Wednesday’s close and before Thursday’s open, as Nvidia reports after the bell on Wednesday.
- Post-earnings (T+1) shows an average gain of 3.5% and a median gain of 2.9%. The tight gap between the median and average suggests returns are broadly consistent rather than skewed by a few outsized moves.
- T+2 to T+4 also show average positive returns, but the moves are small enough to attribute to Nvidia’s broader long-term uptrend. Median returns are notably softer, with T+2 low and T+4 slipping to –0.5%.
- Volatility peaks at T+1 (post earnings) with an average high-to-low range of 6.6% and median range of 4.3%
- Volatility remains slightly elevated between T2 to T4
- Nvidia has also tended to soften ahead of the event. The final trading day before earnings shows an average return of –0.3% and a median of –0.5%, indicating that a modest dip into the release is typical.
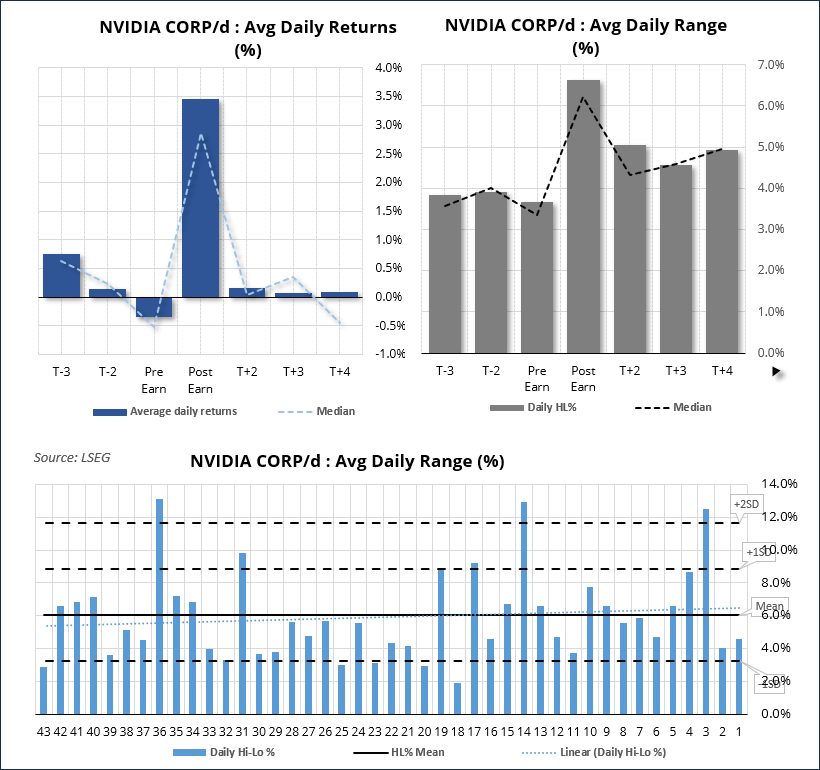
Chart analysis by Matt Simpson - data source: NYSE, LSEG
Nvidia (NVDA) Daily Technical Outlook: Key Support Levels Ahead of Earnings
Given Nvidia’s strong history of beating expectations and its tendency to rally post-earnings, it’s notable that the share price is still holding above key support. A bullish hammer formed around the 180 level, followed by a two-bar bullish reversal that established a higher low. The 100-day SMA (179.76) and a high-volume node (HVN) at 179.27 sit just beneath price, reinforcing this support cluster.
Unless Nvidia breaks from its long-running trend with a weak result, the near-term bias favours a bounce. Bulls can justify a constructive stance while price holds above 177.76, with a retest of 200 in focus.
However, with the weekly chart warning that a broader top may be forming, I’m also watching for a swing high. Whether that develops straight after earnings or later, a break below 177 increases the risk of a deeper pullback toward the 164 swing low.
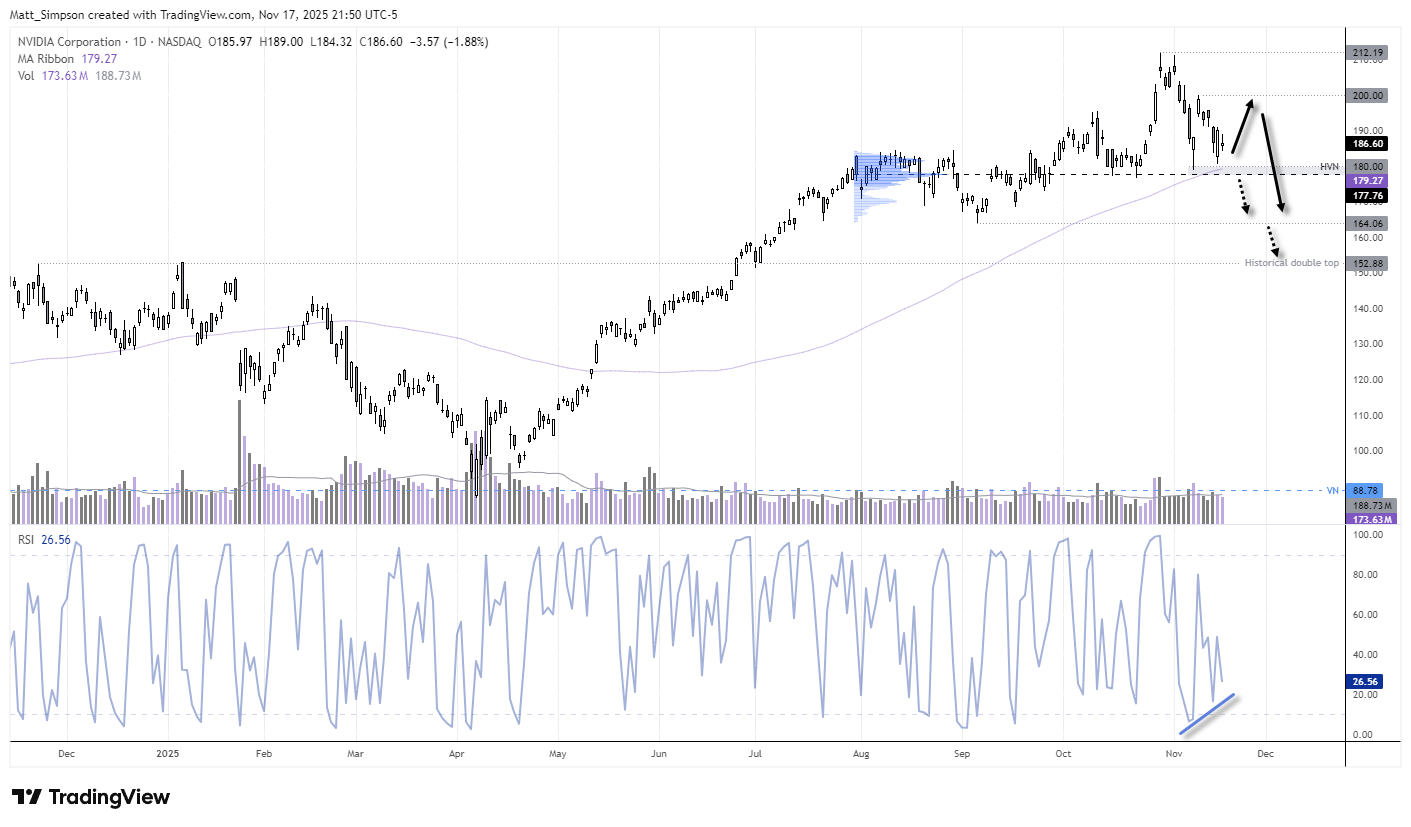
Chart analysis by Matt Simpson - data source: NYSE, TradingView

Nasdaq Correlations Remains Tight with Nvidia
Correlations between major markets always shift, but the link between the Nasdaq 100 and Nvidia remains exceptionally strong. The 10-day correlation sits at 0.91, the 20-day at 0.84, and the 60-day at 0.89. Anything above 0.8 signals a strong positive correlation, while readings below –0.8 indicate a strong inverse one.
Apple’s correlation with the Nasdaq has weakened noticeably, likely reflecting its reduced investment in AI hardware compared with other megacaps.
The Philadelphia Semiconductor Index (SOX) also shows a firm relationship with the Nasdaq, holding a 10-day correlation of 0.92. Ultimately, Nvidia’s earnings results continue to exert outsized influence on the semiconductor sector, the Nasdaq 100, and broader Wall Street sentiment.

Chart analysis by Matt Simpson - data source: NYSE, TradingView
Nasdaq 100 Technical Outlook: Oversold Signals vs Broader Downside Risk
The Nasdaq 100 has fallen 6.7% over the past 11 sessions from its record high. With the daily RSI (2) deeply oversold and a bullish pinbar at monthly S1, a short-term bounce is possible.
But the wider structure remains bearish. The Nasdaq banking index continues to lead the selloff, and the daily RSI (14) sits below 50 with no bullish divergence — not a backdrop that supports a durable low.
Rallies into the 50-day SMA (25,113) or monthly pivot around 25,500 could attract sellers, with scope for a move back toward 24,158, aligning with a 100% projection level.

Chart analysis by Matt Simpson, Source: TradingView, CME Futures, NASDAQ 100 E-mini Futures
View the full economic calendar
-- Written by Matt Simpson
Follow Matt on Twitter @cLeverEdge
How to trade with City Index
You can trade with City Index by following these four easy steps:
- Open an account, or log in if you’re already a customer
• Open an account in the UK
• Open an account in Australia
• Open an account in Singapore
- Search for the market you want to trade in our award-winning platform
- Choose your position and size, and your stop and limit levels
- Place the trade


