
- S&P 500 forecast: Geopolitics and crude oil prices remain firmly in the driver’s seat
- FOMC could be more hawkish in light of oil surge
- Technical levels to watch on S&P 500
Today’s FOMC meeting comes at a time when it is all about energy prices and how that feeds into inflation and in turn policy decisions by the Fed and other major central banks. Unfortunately, things aren’t looking great with Brent oil breaking past $107 after trading as low as $98 earlier in the day. Iran has threatened to attack Middle East energy facilities after Israel struck its largest natural gas processing facility. The latest jump in oil prices means we will continue with our cautious S&P 500 forecast in the near term.
What to expect from the FOMC and Powell today?
Today’s FOMC meeting lands at bad time with the Middle East conflict injecting fresh volatility into both energy markets and the broader macro outlook. Before all this kicked off, the global economy was ticking along reasonably well. The US was slowing, but not dramatically as consumption held up, and AI-driven investment continued to do a fair bit of heavy lifting. Inflation, while still above target, wasn’t throwing up any major surprises. In the eurozone, domestic demand was keeping things afloat despite weak exports, while China leaned heavily on exports to offset soft internal demand.
That backdrop has shifted. And quite dramatically so. Since the conflict escalated, oil and gas prices have surged. That feeds directly into near-term inflation risks. The bigger concern, though, is disruption. If key routes like the Strait of Hormuz remain constrained, it’s not just energy — supply chains more broadly start to feel the strain. But worrying, it Iran now destroys energy infrastructure of Gulf states, that could be a huge problem for the world economy.
With financial conditions already tightening and yields higher, that’s beginning to weigh on equities and gold, while also raising questions about growth. In simple terms, the balance of risks is becoming uncomfortable: growth is tilting lower, while inflation risks are creeping back up. In other words, stagflation.
That leaves central banks, including the Federal Reserve and European Central Bank, in a tricky spot. They’ll be watching developments closely, but the key point is flexibility. If the situation deteriorates and the conflict is prolonged, they’ll need to respond to maintain confidence that price stability remains under control.
Could Central banks cause even more selling?
If policymakers appear a lot more hawkish in response to rising energy prices and inflation risks, that could further remove support for equities already on edge. On the flip side, a more measured tone could give markets some breathing room, especially if they can convince market that the oil shock is seen as temporary in nature rather than a structural shift. But if oil facilities get destroyed in the Middle East, then we could see massive increases in energy prices and for a much longer period.
Markets back in risk off mode
Earlier in the week, there was a sense that equities were beginning to steady themselves. Dip buyers stepped back in, volatility eased a touch, and for a moment it looked like markets were willing to look through the noise. That optimism hasn’t lasted. A fresh spike in oil prices, driven by escalating tensions in the Middle East, has pulled sentiment back into fragile territory.
At this point, it’s hard to argue against the idea that crude is calling the shots. As long as energy prices remain elevated, equities are going to struggle to build any meaningful upside momentum.
Crude oil nears $108 – and markets take notice
Brent surging back above the $100 mark to near $108 per barrel has quickly undone the tentative calm we saw earlier in the week. The concern isn’t just the price itself — it’s what it represents. Markets are now having to price in the risk that supply disruptions linger, rather than fade quickly.
There was some hope that tensions might cool, particularly after earlier Trump comments hinted at de-escalation. But that narrative has shifted again, and traders are now back to reacting headline by headline.
Equities dip when oil spikes, recover when tensions ease — rinse and repeat. It’s not exactly a comfortable environment for holding risk.
Technical picture: Still surprisingly rangebound
From a technical standpoint, the S&P 500 still looks like it’s stuck in a broad consolidation phase — though there’s a slight bearish bias creeping in.
The key short-term level sits in the 6,667 region. This zone has acted as a major pivot in recent days. A clean break below that area would shift the tone quite quickly.
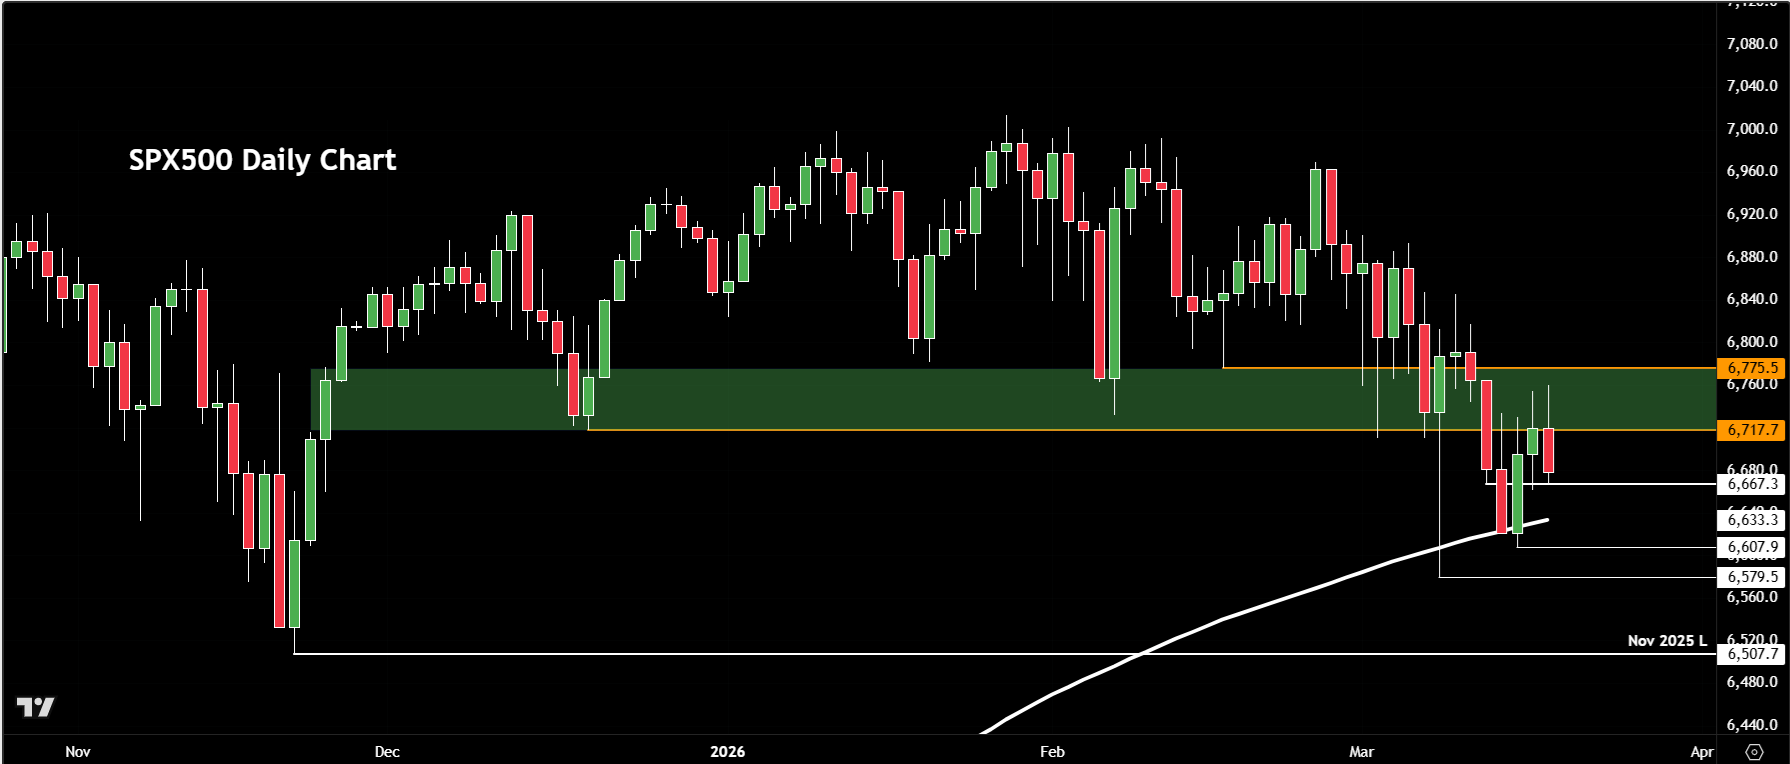
Then there’s the 200-day moving average, sitting near 6,634, on our US SP 500 chart, derived from the underlying S&P 500 futures. This is the line in the sand from a broader perspective. It’s held up well so far, attracting buyers on dips, but if it gives way on a closing basis, the narrative changes. At that point, a move towards the 6,525 region wouldn’t look far-fetched.
Resistance is at 6717-5775, shaded on the chart. Only reclaiming this zone on a daily closing basis would be a meaningful signal that buyers are regaining control. Without that, any short-term rallies risk looking like little more than short-covering bounces.

-- Written by Fawad Razaqzada, Market Analyst
Follow Fawad on Twitter @Trader_F_R
How to trade with City Index
You can trade with City Index by following these four easy steps:
- Open an account, or log in if you’re already a customer
• Open an account in the UK
• Open an account in Australia
• Open an account in Singapore
- Search for the company you want to trade in our award-winning platform
- Choose your position and size, and your stop and limit levels
- Place the trade