
S&P 500 and Nasdaq 100 futures reached new record highs on Monday, although trading conditions remain choppy and both indices gave back much of their early-week gains. Wall Street futures gapped higher at the open following news of a US-EU trade deal, but sentiment around the agreement is mixed. France criticised the 15% tariffs as a “submission,” while other member states view the deal as better than no deal—albeit far from ideal.
View related analysis:
- ASX 200 Eyes 9,000 as Bulls Defend Dips Ahead, RBA Mins In Focus
- AUD/USD Slumps, ASX Hits Record as RBA Rate Cut Bets Rise After Soft Jobs Data
- ASX 200 Rally Stalls Below Key Resistance as Seasonal Tailwinds Fade
Wall Street Futures Mixed After Highs, ASX 200 Nearing Key Support
- S&P 500 futures are holding above 6400, though a 2-bar bearish reversal pattern (dark cloud cover) has formed on the daily chart.
- Nasdaq 100 futures printed a small shooting star candle, and with prices extended above the 10-day EMA, a minor pullback could be due.
- Dow Jones futures are struggling to gain traction above the July high and show the potential to dip back below 45,000 in the near term. Bearish divergence has also formed on the daily RSI (14).
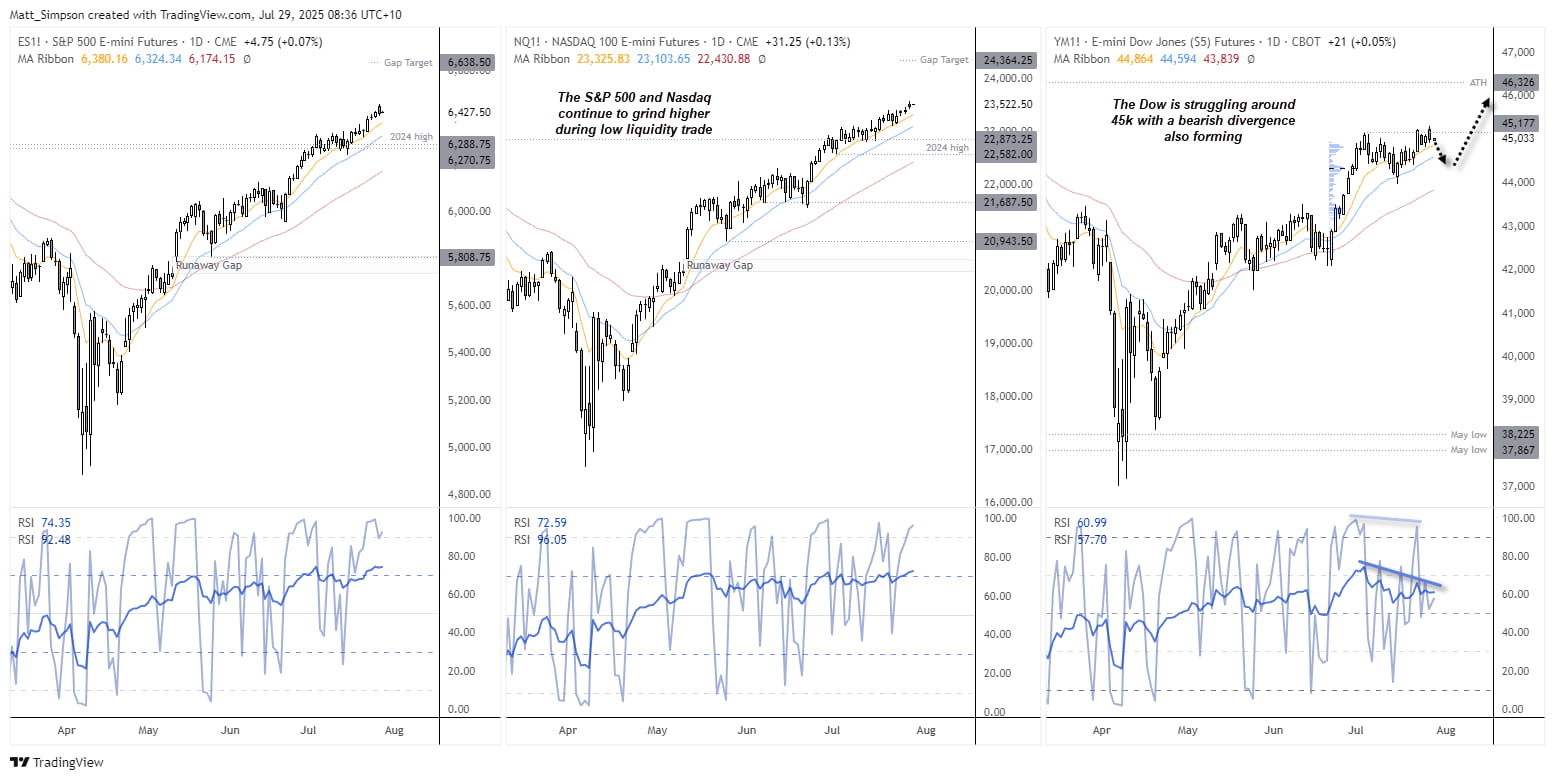
Chart analysis by Matt Simpson, Source: TradingView, CME Futures, S&P 500 E-mini Futures, NASDAQ 100 E-mini Futures, Dow Jones E-mini Futures

ASX 200 Futures (SPI 200) Technical Analysis
Last week I outlined my bias for the ASX 200 to retreat lower before continuing its move towards 9,000. Prices have indeed been grinding lower and may well move towards the high-volume node (HVN) at 8,537 before a low is found. For now, the ASX 200 is holding above the December high, so we should also be on guard for a swing low to form soon, given its bullish trend structure on the daily chart.
A double bottom has formed on the 1-hour chart around the December high, leaving the potential for a bounce in todays session. Though Monday’s relatively long, bearish inside day suggest bears remain in control and a move towards the HVN (8535) remain on the cards. At which point, ASX bulls could reconsider its potential for a swing low to form on the daily chart.
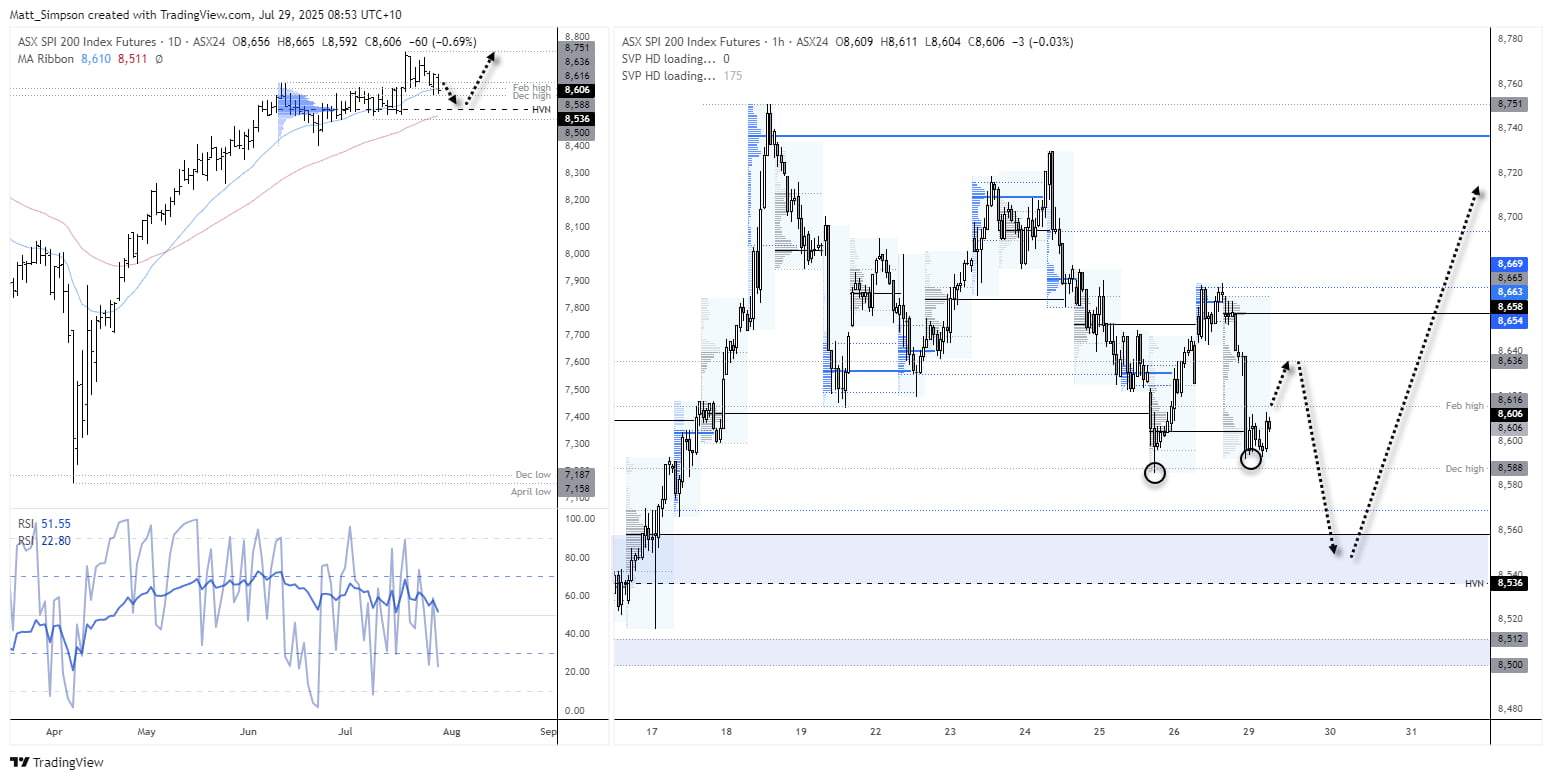
Chart analysis by Matt Simpson - Source: TradingView, ASX SPI 200 Index Futures, S&P/ASX 200 Index
Key Economic Events for Traders (AEST / GMT+10)
13:35 JPY 2-Year JGB Auction (USD/JPY, EUR/JPY, AUD/JPY, Nikkei 225)
16:00 SEK GDP (Jun/Q2) (EUR/SEK, USD/SEK, GBP/SEK)
16:00 NOK Core Retail Sales (Jun) (EUR/NOK, USD/NOK, NOK/SEK)
17:00 EUR Spanish GDP (Q2), Retail Sales (YoY) (Jun) (EUR/USD, EUR/JPY, EUR/GBP, IBEX)
18:00 EUR Italian Trade Balance Non-EU (Jun) (EUR/USD, EUR/JPY, EUR/CHF)
18:30 GBP BoE Consumer Credit, M3, M4, Mortgage Lending, Approvals, Net Lending to Individuals (Jun) (GBP/USD, EUR/GBP, GBP/JPY, FTSE 100)
19:30 EUR German 5-Year Bobl Auction (EUR/USD, EUR/GBP, EUR/JPY)
20:00 EUR France Jobseekers Total (Jun) (EUR/USD, EUR/JPY, EUR/GBP)
22:00 EUR Spanish Consumer Confidence (Jun) (EUR/USD, EUR/JPY, EUR/CHF)
22:30 USD Goods Trade Balance, Retail Inventories ex Auto, Wholesale Inventories(Jun) (EUR/USD, USD/JPY, GBP/USD, S&P 500)
22:55 USD Redbook (EUR/USD, USD/JPY, AUD/USD, S&P 500)
23:00 USD House Price Index, S&P/CS HPI Composite 20 s.a./n.s.a. (May) (USD/JPY, GBP/USD, EUR/USD, S&P 500)
00:00 USD CB Consumer Confidence (Jul), JOLTS Job Openings (Jun) (USD/JPY, EUR/USD, USD/CAD, S&P 500)
00:30 USD Dallas Fed Services Revenues, Texas Services Sector Outlook (Jul) (USD/JPY, USD/CAD, EUR/USD, S&P 500)
01:30 USD Atlanta Fed GDPNow (USD/JPY, EUR/USD, AUD/USD, S&P 500)
02:00 USD 7-Year Note Auction (USD/JPY, EUR/USD, GBP/USD, Treasury Markets)
View the full economic calendar
-- Written by Matt Simpson
Follow Matt on Twitter @cLeverEdge
How to trade with City Index
You can trade with City Index by following these four easy steps:
- Open an account, or log in if you’re already a customer
• Open an account in the UK
• Open an account in Australia
• Open an account in Singapore
- Search for the market you want to trade in our award-winning platform
- Choose your position and size, and your stop and limit levels
- Place the trade