


The risk-off tone swept across global markets on Thursday, with the Nasdaq 100 leading Wall Street’s decline and safe-haven flows once again favouring the Swiss franc. Overstretched AI stocks were hit hardest, while uncertainty around incoming US data and fading expectations of a December Fed cut kept pressure on the US dollar. Commodity currencies also weakened sharply as volatility picked up across FX majors.
View related analysis:
- Yen Crosses in Focus as USD/JPY Stalls and CHF/JPY Nears Record Highs
- Nasdaq 100 Lags Dow Jones: Divergent Signals Among Nvidia, Apple, Meta
- Australian Dollar Jumps, ASX Falls as Strong Jobs Data Fuels RBA Hike Bets
- ASX 200 Evening Wrap: ANZ Drags Financials Lower in Broad Market Selloff
- ASX 200 Evening Wrap: Tech and Banks Extend Losses, WOW Perks Up
Swiss Franc Strengthens as Markets Shift to Risk-Off
Risk-Off Drives Wall Street Lower as Tech Stocks Crack
It was a clear risk-off session on Thursday, with the Nasdaq 100 leading Wall Street lower in its worst day in a month. Overvalued AI stocks were front and centre: Nvidia fell more than 5%, Tesla dropped 7%, and selling extended across AMD, Broadcom and Palantir as traders questioned whether stretched AI valuations can survive a hot inflation print.
The brief relief rally tied to the U.S. government reopening now looks priced in. Focus has shifted to how long it will take for major economic releases to resume. Some reports suggest the upcoming Nonfarm Payrolls release may be published without an unemployment rate — adding uncertainty rather than removing it.
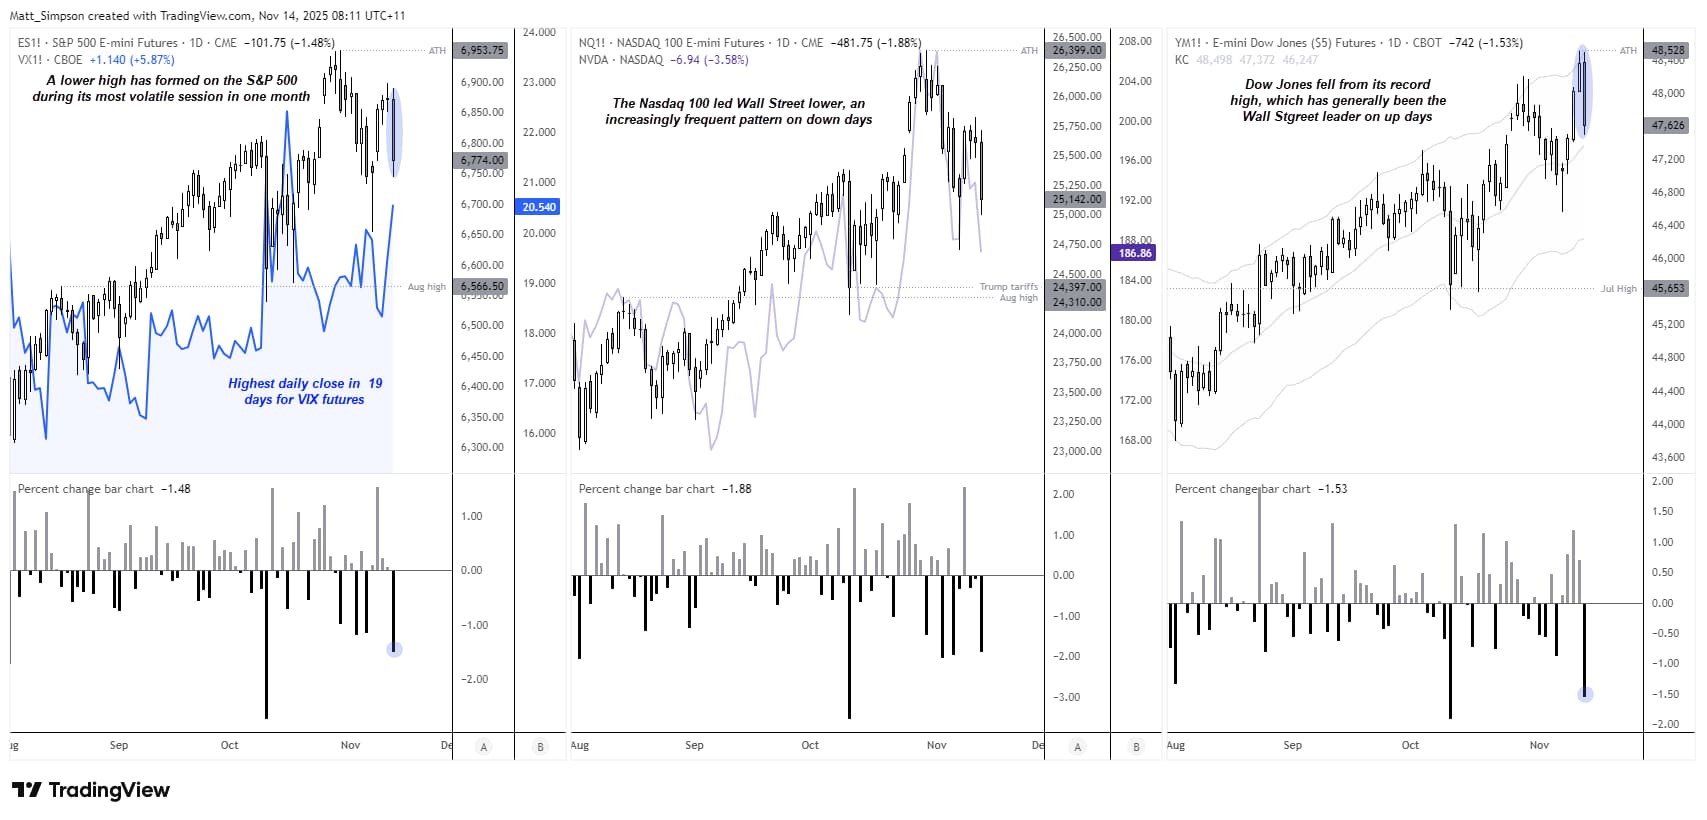
Chart prepared by Matt Simpson - Source: TradingView
That uncertainty feeds into doubts over a December rate cut. Jerome Powell warned that a cut is “far from” guaranteed, while Susan Collins said there is a “relatively high bar” for easing. With key data delayed and inflation risks still alive, the Fed has little conviction to move early. Even a slightly hotter CPI print today could deepen risk aversion, pressure Wall Street again, and boost safe-haven currencies such as the Swiss franc and, to a lesser extent, the yen.

Swiss Franc Leads FX Markets for a Third Session
The Swiss franc was the strongest forex major for the third consecutive day, taking in risk-off flows and still brimming from headlines Trump touting a trade deal with Switzerland. Notice that the bearish volatility was seen predominantly against commodity currencies (AUD, CAD and NZD) and the US dollar.
Hot inflation is a concern for Wall Street, but it’s not lifting the US dollar because traders know the Fed won’t hike again. And with the government now reopening, the prospect of future rate cuts is still alive once the data flow normalises — keeping the dollar on the back foot.
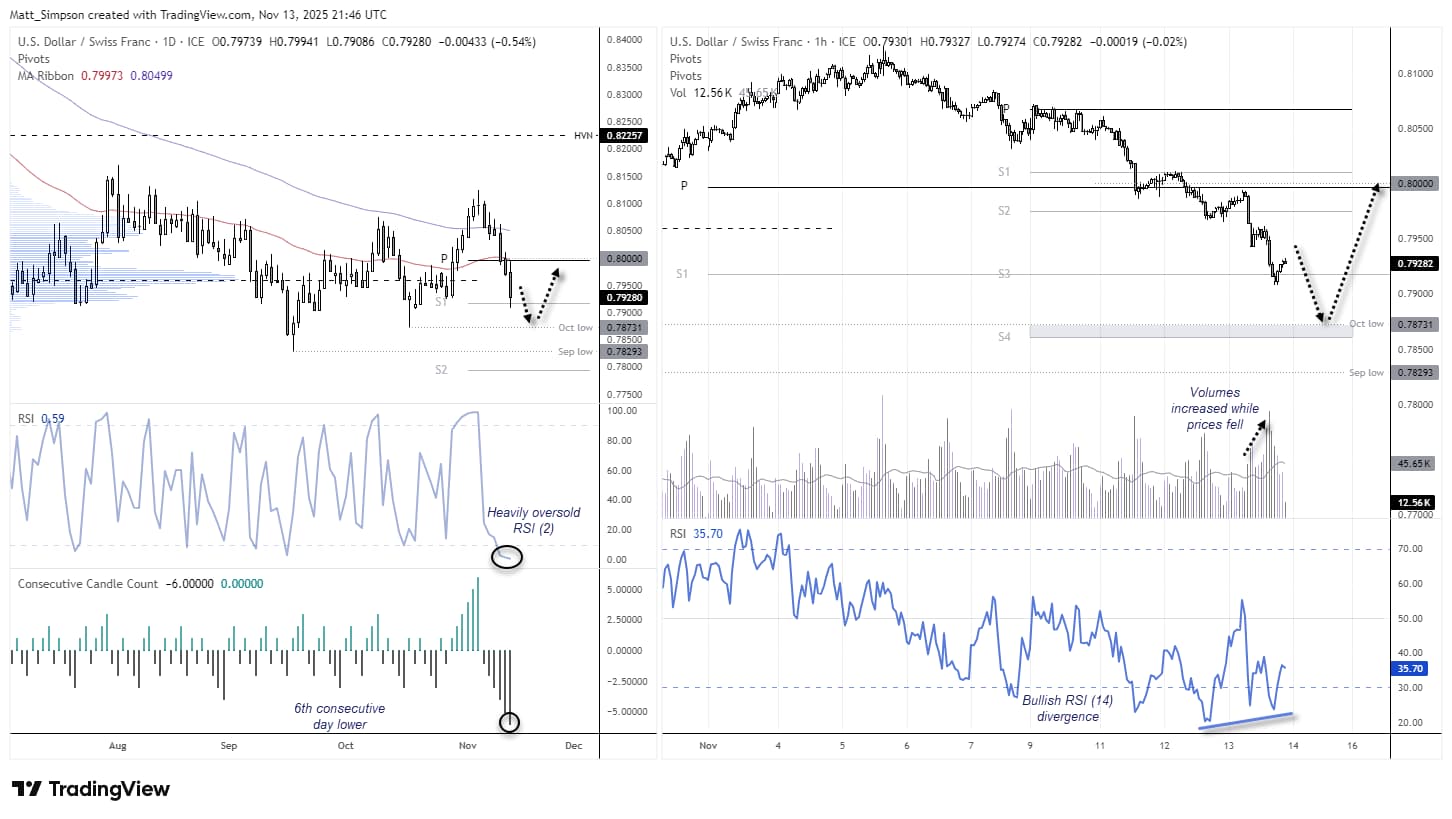
Chart prepared by Matt Simpson - Source: LSEG
Commodity FX Under Pressure as Swiss Franc Extends Rally
- USD/CHF fell for a sixth straight session — its most bearish run since July — as the US dollar continued to weaken against the dominant Swiss franc.
- EUR/USD climbed to an 11-day high during its strongest session in five days.
- GBP/USD rose 0.4%, in line with the bullish bias I outlined on Thursday, with a retest of the 200-day EMA (1.3260) still in play.
- AUD/USD handed back its post-employment gains and printed a bearish hammer as risk-off sentiment intensified.
- USD/CAD posted a bullish outside day, hinting at a potential swing low forming around 1.40.
- USD/JPY hit my 155 target — a level many see as a possible BOJ intervention line — while its spinning-top candle warns of a near-term pullback.
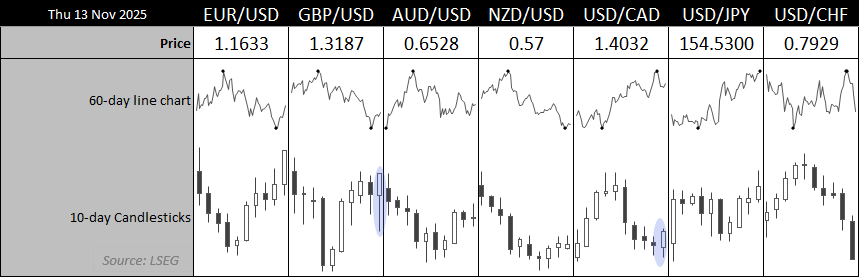
Chart prepared by Matt Simpson - Source: LSEG

USD/CHF Technical Analysis: US Dollar vs Swiss Franc
The Swiss franc is in its most bullish daily run in four months against the US dollar, with USD/CHF falling for a sixth straight session. The pair briefly paused around 0.80 two days ago but has since broken beneath it with little resistance.
The daily S1 pivot at 0.7916 is currently acting as support, the RSI (2) is extremely oversold below 1, and the September–October swing lows sit just underneath. Together, these factors suggest USD/CHF may be nearing an inflection point on the daily chart — even if price action has yet to confirm a reversal.
For now, the 1-hour trend remains clearly bearish, and sellers may look to fade minor rallies towards the October low at 0.7831 near the weekly S4 pivot. But with signs of an overextended move beginning to build — including bullish RSI divergence — bears may need to stay nimble and be prepared for a countertrend bounce, particularly if US inflation delivers a surprise.

Chart prepared by Matt Simpson - Source: TradingView
Economic Events in Focus (AEST / GMT+10)
Friday, November 14, 2025
12:30 CNY House Prices, Industrial Production, Retail Sales & Fixed Asset Investment (Oct), NBS Press Conference (USD/CNH, AUD/USD, Hang Seng Index)
15:30 JPY Tertiary Industry Activity Index (Sep) (USD/JPY, EUR/JPY, Nikkei 225)
18:00 CNY FDI (Oct) (USD/CNH, AUD/USD, Hang Seng Index)
21:00 EUR GDP, Employment & Trade Balance (Q3–Sep) (EUR/USD, EUR/GBP, DAX)
23:30 USD Jobless Claims & Productivity Data (Q3) (S&P 500, Nasdaq 100, USD/JPY)
Saturday, November 15, 2025
00:00 GBP NIESR Monthly GDP Tracker (Oct) (GBP/USD, EUR/GBP, FTSE 100)
00:30 CAD Manufacturing, Wholesale & Vehicle Sales (Sep) (USD/CAD, CAD/JPY, S&P/TSX)
00:30 EUR ECB’s Elderson Speaks (EUR/USD, EUR/GBP, DAX)
01:20 USD FOMC Member Bostic Speaks (S&P 500, Nasdaq 100, USD/JPY)
02:05 USD Fed Schmid Speaks (S&P 500, Nasdaq 100, USD/JPY)
04:00 USD Atlanta Fed GDPNow (Q4) (S&P 500, Nasdaq 100, USD/JPY)
05:00 USD Baker Hughes Rig Count (WTI Crude, Brent Crude, USD/CAD)
06:00 USD Federal Budget Balance (Oct) (S&P 500, Nasdaq 100, USD/JPY)
06:30 USD Fed Logan Speaks (S&P 500, Nasdaq 100, USD/JPY)
View the full economic calendar
-- Written by Matt Simpson
Follow Matt on Twitter @cLeverEdge
How to trade with City Index
You can trade with City Index by following these four easy steps:
- Open an account, or log in if you’re already a customer
• Open an account in the UK
• Open an account in Australia
• Open an account in Singapore
- Search for the market you want to trade in our award-winning platform
- Choose your position and size, and your stop and limit levels
- Place the trade


