
Swiss Franc Technical Forecast: USD/CHF Short-term Trade Levels
- USD/CHF has rallied more than 3% after breaking out of its February contractionary range, marking the strongest advance in weeks.
- Inflection risk builds as price confronts a confluence resistance zone that aligns with key retracement and prior breakdown levels.
- A sustained close above this barrier would signal a larger recovery phase, while rejection here risks a pullback towards trend support
- Resistance 7856/74 (key), 7927, 7974/75- Support 7786, 7742, 7695 (key)
USD/CHF has broken free from its February consolidation and pushed sharply higher into early March, reclaiming ground lost during the January slide. The advance has been swift, but price is now confronting a technically significant ceiling that has previously acted as a pivot within the broader trend. Momentum favors buyers in the near term, yet the rally’s durability will depend on whether this resistance can be decisively cleared. A confirmed breakout would strengthen the case for a broader recovery, while hesitation at this level could signal that the move was corrective rather than structural. Battles lines drawn on the USD/CHF short-term technical charts.
Swiss Franc Price Chart – USD/CHF Daily
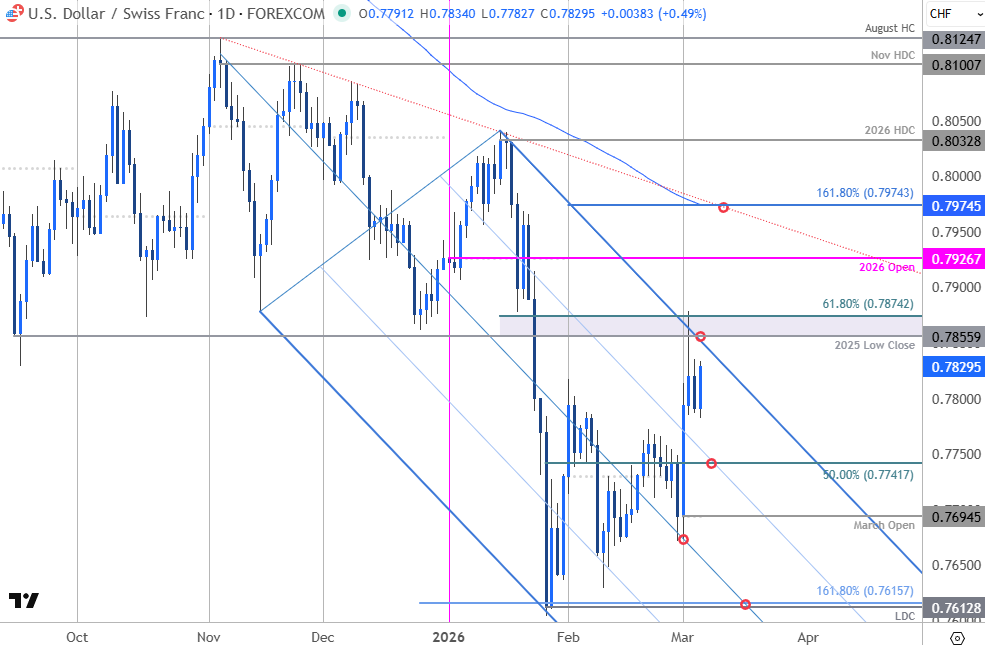
Chart Prepared by Michael Boutros, Sr. Technical Strategist; USD/CHF on TradingView
Technical Outlook: USD/CHF was trading within a contractionary range throughout February before breaking sharply higher into the start of March. The really extended nearly 3.3% off the February low before exhausting into confluent resistance on Tuesday at 7856/74- a region defined by the 2025 low-close and the 61.8% retracement of the January decline. Note that the upper parallel converges on this threshold into the close of the week and a break / daily close above this level is region is needed to suggest a more significant low is in place and a larger trend reversal is underway. The focus is on inflection off this zone in the days ahead.
Swiss Franc Price Chart – USD/CHF 240min
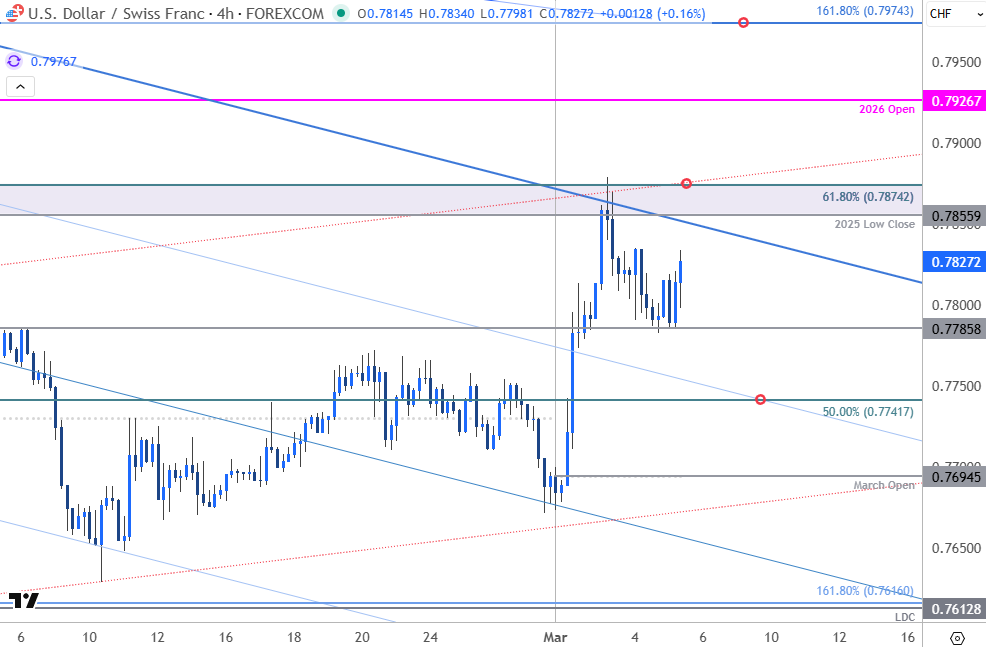
Chart Prepared by Michael Boutros, Sr. Technical Strategist; USD/CHF on TradingView
Notes: A closer look at Swisse price action shows USD/CHF trading within the confines of an embedded ascending channel extending off the January low with the upper parallel further highlighting resistance at 7856/74. Strength beyond this pivotal zone would expose subsequent resistance objectives at the yearly open at 7927 backed by the 1.618% extension of the January rally and the 200-day moving average at 7974/75. Look for a larger reaction there IF reached.
Initial support now rests at 7786 and is backed by the 50% retracement of the January rally at 7742. Note that this level converges on the median-line next week and losses below this slope would threaten a deeper pullback within the near-term uptrend towards the March open at 7695. We’ll reserve this threshold as our near-term bullish invalidation level and a break / close below would be needed to mark resumption of the broader downtrend.

Bottom line: USD/CHF trading just below pivotal resistance and a reaction off this mark could determine monthly direction. From a trading standpoint, losses should be limited to 7742 IF price is heading for a breakout on this stretch with a close above 7874 needed fuel the next major leg of the advance.
Keep in mind we get the release of key labor data tomorrow with the highly anticipated Non-Farm Payroll report on tap. With the Iranian war fueling a surge in oil prices, the inflationary outlook is now under pressure, and a better-than-expected jobs report tomorrow could further push out expectations of future cuts form the Fed- to the benefit of the US Dollar. Stay nimble into the release and watch the weekly close here for guidance. Review my latest Swiss Franc Weekly Forecast for a closer look at the longer-term USD/CHF technical trade levels.
USD/CHF Key Economic Data Releases
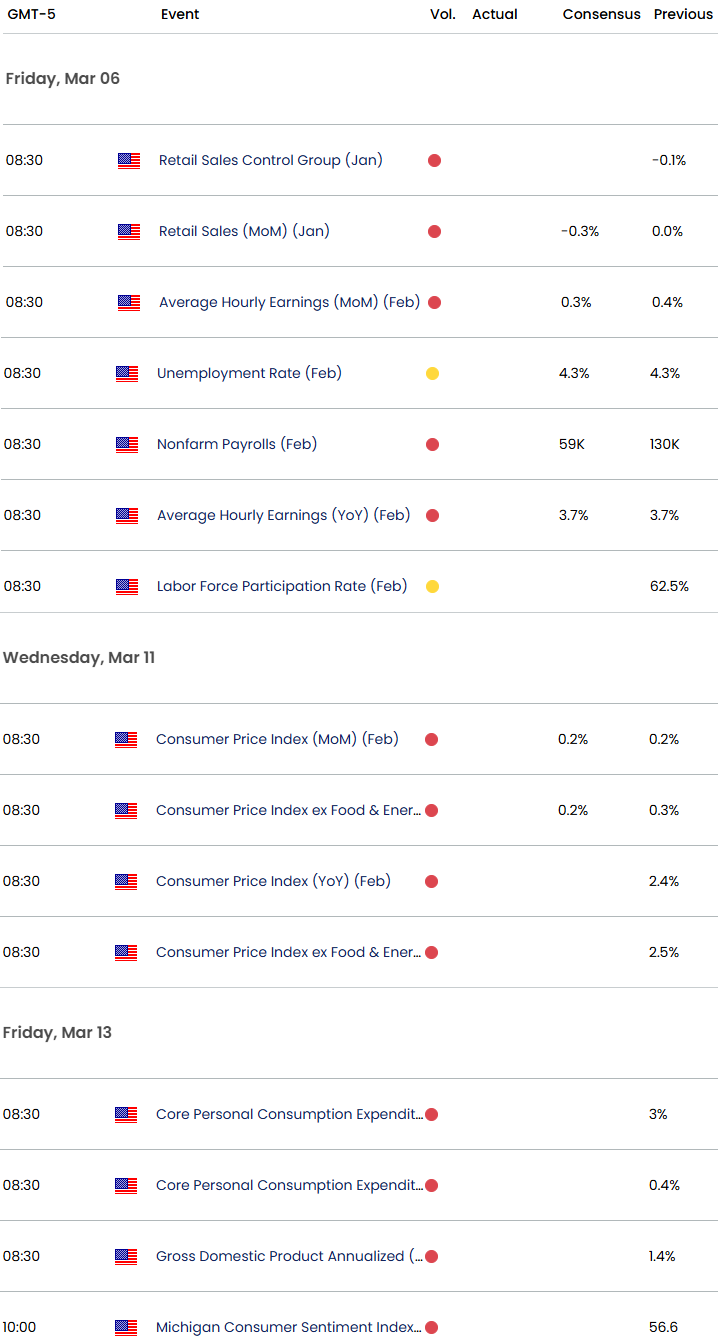
Economic Calendar - latest economic developments and upcoming event risk.
--- Written by Michael Boutros, Sr Technical Strategist
Follow Michael on X @MBForex