


Tesla reports its Q4 earnings after the market close on January 28, delivering both fourth-quarter performance and full-year results. That combination makes this one of the most closely watched earnings releases of the year, giving management an opportunity to reset expectations and frame the outlook for 2026.
Investors are no longer debating price cuts, delivery headlines, or long-dated narratives. That phase has passed, and expectations have already been recalibrated. This earnings release comes down to one question: have margins stabilised, or is the pressure still building?
The aggressive price cuts of the past two years are now firmly in the rear-view mirror. Markets have repriced Tesla for lower pricing power and softer EV demand. What matters now is whether automotive gross margins (ex-credits) are holding steady — or continuing to slip.
With sentiment cautious and positioning far from euphoric, Tesla doesn’t need to impress. It simply needs to show that the damage has stopped.
View related analysis:
- Nvidia (NVDA) Earnings Stats for Nasdaq 100 Traders
- Trade to Watch 2026: Nasdaq 100 Correction Risk Before New Highs
- Nasdaq 100 Lags Dow Jones: Divergent Signals Among Nvidia, Apple, Meta
- Dead Cat Bounce Explained: How False Rallies Form in Downtrends
Tesla (TSLA) Earnings – What the Market Is Watching
1. Gross Margins – Stabilisation or Further Slippage?
Margins are the key battleground for investors. While markets are not looking for a rebound, they will want to see signs that margins are stabilising after two years of price pressure. Even evidence that margins are deteriorating at a slower pace could be enough to support sentiment, while further slippage would likely reopen downside risks.
Tesla’s reported automotive gross margin (%) has trended lower over the past year, reflecting the impact of price cuts and softer EV demand. While this measure includes regulatory credits, it provides useful context on the direction of underlying profitability ahead of the Q4 earnings release.
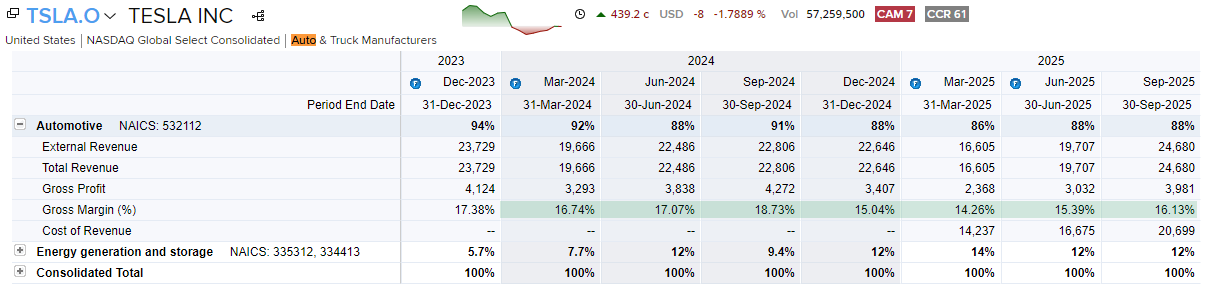
Chart analysis by Matt Simpson – Source: LSEG (TSLA)
2. Robotaxi Expansion Signals
Speculation continues around a broader Robotaxi rollout, with some investors floating expansion into multiple new cities by 2026. However, there is no confirmed guidance from Tesla on city count or timing, making any large-scale rollout narrative aspirational rather than concrete at this stage.
3. Full Self-Driving (FSD) Pricing Shift and Near-Term Cash Flow
Cash flow could face near-term pressure as Tesla transitions Full Self-Driving from a large upfront purchase to a subscription-led model. Moving away from an ~$8,000 one-off fee toward a ~$99 monthly subscription improves long-term revenue visibility, but reduces upfront cash receipts, making the transition phase worth watching.
4. Guidance Risk – Where Earnings Volatility Lives
Tesla’s post-earnings moves are often driven more by guidance than headline results. Markets will listen closely for signs of pricing discipline versus renewed demand stimulation, with defensive language likely to weigh on sentiment.
5. Inventory and Demand Quality
Inventory trends will be watched for clues on demand quality. Rising inventory could suggest volumes are being supported by incentives, while stable or falling inventory would help reinforce the case that pricing pressure is easing.

Tesla (TSLA) Earnings Scenarios – Bull vs Bear
TSLA Bull case
- Automotive gross margins stabilise or deteriorate less than feared
- Guidance avoids fresh downside on pricing or demand
- Inventory remains controlled, supporting demand quality
- FSD subscription shift framed as a timing issue, not a margin drag
- Likely reaction: relief rally, short covering, upside extension if guidance holds
TSLA Bear case
- Margins slip further, reinforcing structural profitability concerns
- Guidance turns defensive or signals renewed pricing pressure
- Inventory builds, raising concerns over incentive-led volumes
- Cash flow deterioration draws focus as FSD revenue shifts monthly
- Likely reaction: gap lower or continuation sell-off, with downside momentum accelerating
With expectations reset, the post-earnings move will likely be driven by whether margins signal stability or renewed stress, rather than headline beats or misses.

Tesla Weekly Chart Signals Growing Pullback Risk
The weekly chart shows trading volumes have been declining since the rally began in April. While this does not necessarily signal an imminent bearish reversal, it is a factor worth monitoring as the year unfolds. Heavier volumes earlier in the move are also consistent with large institutional investors stepping in when valuations appeared more attractive.
That said, traders should remain mindful of the risk of a deeper pullback given recent price action. The rally into the December high stalled just shy of the 500 handle, before a two-bar bearish reversal pushed prices back below the 2024 high. This was followed by a post-Christmas gap lower, forming an island reversal — a bearish pattern that has been known to appear near major market tops.
However, last week’s doji candle suggests support is holding above 420 and points to the potential for an interim low. In addition, options positioning shows call interest outweighing puts into the earnings event, leaving scope for a pre-earnings bounce. Any disappointment in Tesla’s results or its 2026 outlook, however, could quickly see bearish pressure return and expose a move back below 400.

Chart analysis by Matt Simpson – Source: TradingView (NASDAQ)
Tesla (TSLA) Technical Outlook: Near-Term Bounce Risk Ahead of Earnings
The daily chart shows the December sell-off found support around the 100-day EMA at 424.37, followed by a three-day rally. While prices have retraced over the past two sessions, downside volatility has remained contained. This suggests bulls may be looking to re-enter, with scope for a move back above last week’s high in the near term and a potential push toward the 480 area ahead of Tesla’s earnings.
A break below the recent swing low on the daily chart would invalidate this near-term bullish bias, at which point the more bearish signals highlighted on the weekly chart would come back into focus.
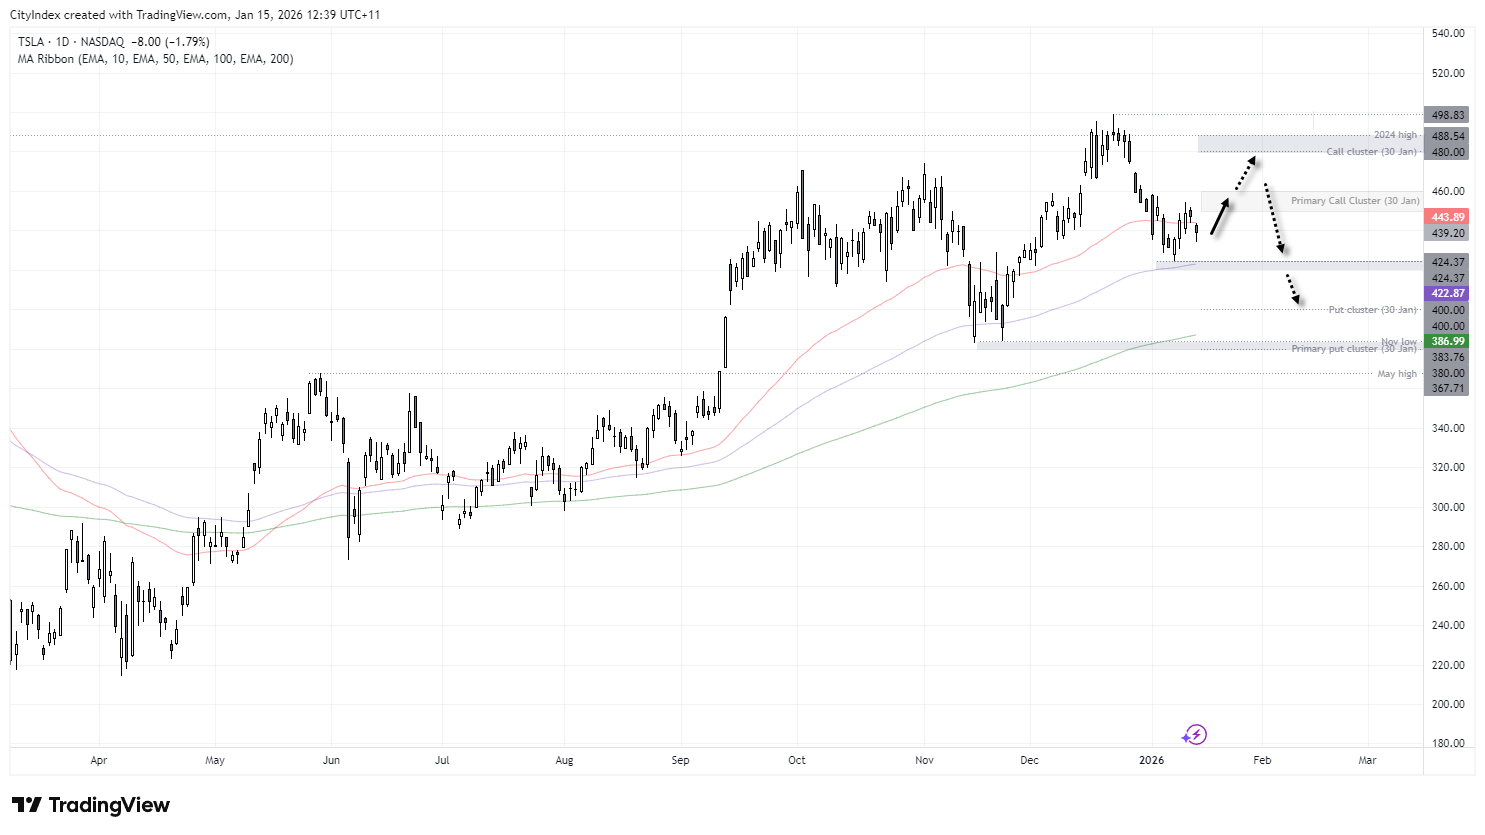
Chart analysis by Matt Simpson – Source: TradingView (NASDAQ)
Options Positioning Ahead of Earnings (30 January Expiry)
Options activity around the 30 January expiry shows notable clustering at several strikes, which may act as reference points for traders into Tesla’s earnings release.
- On the upside, call open interest builds notably between 450 and 460, suggesting this zone could attract attention if shares attempt to rally ahead of earnings.
- On the downside, put open interest is heaviest around 380, with additional interest near 400, highlighting areas where downside moves may begin to encounter greater options-related activity.
With earnings still two weeks away, these levels should be viewed as areas of heightened positioning rather than firm support or resistance, though they may influence price behaviour as the event approaches.
View the full economic calendar
-- Written by Matt Simpson
Follow Matt on Twitter @cLeverEdge
How to trade with City Index
You can trade with City Index by following these four easy steps:
- Open an account, or log in if you’re already a customer
• Open an account in the UK
• Open an account in Australia
• Open an account in Singapore
- Search for the market you want to trade in our award-winning platform
- Choose your position and size, and your stop and limit levels
- Place the trade


