


Seasonality analysis often focuses on longer-term annual trends, but shorter patterns also emerge around major events and holidays. A well-known example is the equity “Santa rally” in late December. Here, we examine market performance around the US Thanksgiving holiday to identify recurring tendencies across the four-day weekend.
View related analysis:
- Nasdaq 100 Outlook: Thanksgiving Seasonality and Volatility Trends
- Nvidia (NVDA) Earnings Stats for Nasdaq 100 Traders
- So how good is APD at predicting NFP, anyway?
- The stats are working against bitcoin bulls today
Thanksgiving Seasonality: USD, EUR/USD and Gold
US Dollar Index (DXY) Technical Analysis
A clear pattern emerges for the US dollar heading into Thanksgiving, with the Dollar Index posting negative average returns on the Monday, Tuesday and Wednesday before the holiday. Each of these days has a win rate below 50%, with Tuesday closing lower 59.4% of the time based on data going back to 1985.
Wednesday — the eve of Thanksgiving — records the widest average and median daily range at 0.74%, indicating consistent volatility rather than a result skewed by outliers.
Volatility is lowest on Thanksgiving Day itself as US futures markets are closed, before expanding again as traders return and refocus on broader macro factors. Median and average ranges track closely, reinforcing reliability of the data.
While both Thanksgiving Day and the following Monday (TG+2) show small positive average returns, the median is flat on TG but stronger on Monday. The broader theme, however, remains a softer US dollar heading into the long weekend.

Chart analysis by Matt Simpson - data source: ICE, LSEG

EUR/USD EUR/USD Technical Analysis: Euro vs US Dollar
Tuesday (TG-2) delivers the best average return at 0.05% ahead of Thanksgiving, with a higher median at 0.08%. Its 66.7% win rate highlights a clear bullish bias for EUR/USD on this day.
The strongest performance arrives the Tuesday after Thanksgiving, averaging 0.12% with a median of 0.20%. The 57% win rate is likely influenced by the normalisation of liquidity as traders return from the holiday. This Tuesday also has the second-narrowest daily range, averaging 0.71% with a median of 0.64%.
Wednesday (TG-1) produces the widest average daily range at 0.91% and a median of 0.80%, suggesting stable and reliable volatility.
As expected, Thanksgiving Day (Thursday) has the narrowest range and the lowest win rate, closing lower 57.6% of the time.

Chart analysis by Matt Simpson - data source: LSEG

Gold Futures (GC) Technical Analysis
The two Mondays either side of Thanksgiving tend to be bearish for gold, with negative average and median returns, higher volatility and the weakest win rates.
The strongest seasonal bias typically emerges on the Tuesday before Thanksgiving and the Friday after, posting win rates of 58.9% and 61.5% respectively.
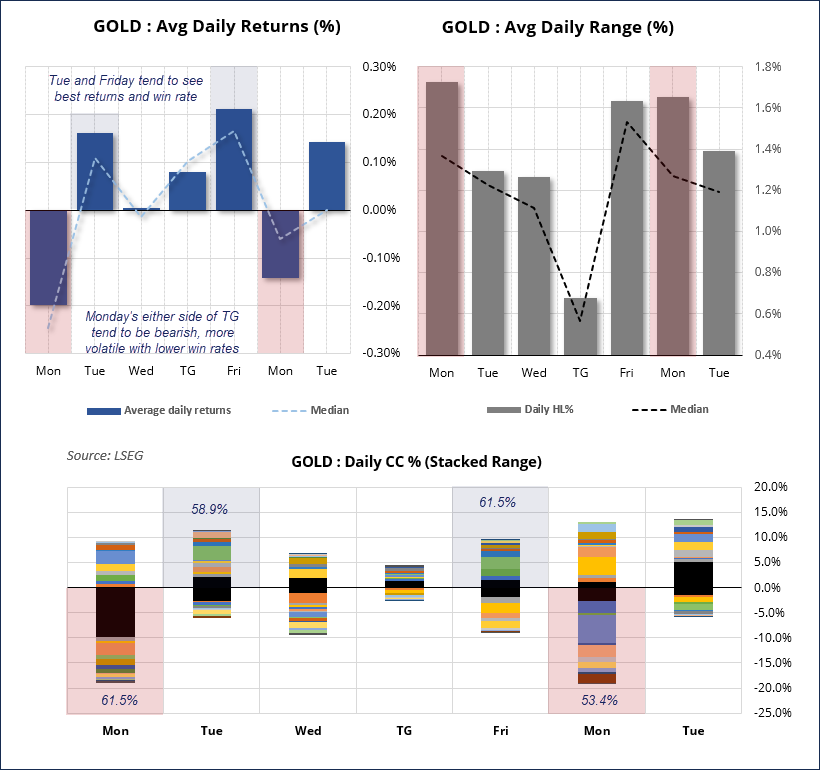
Chart analysis by Matt Simpson - data source: LSEG, COMEX
View the full economic calendar
-- Written by Matt Simpson
Follow Matt on Twitter @cLeverEdge
How to trade with City Index
You can trade with City Index by following these four easy steps:
- Open an account, or log in if you’re already a customer
• Open an account in the UK
• Open an account in Australia
• Open an account in Singapore
- Search for the market you want to trade in our award-winning platform
- Choose your position and size, and your stop and limit levels
- Place the trade


