


The Nasdaq 100 enters 2026 in a mature bull market rather than at the start of a new cycle. While the longer-term trend remains intact, a growing cluster of technical, breadth and earnings-related signals suggests the balance of risks has shifted toward a correction rather than a continuation of the recent rally.
Importantly, this is not a bearish call on technology stocks or the Nasdaq’s secular trend. Instead, the setup points to a more typical late-cycle adjustment — one driven by earnings and guidance risk rather than macro stress — before dip buyers are likely to re-emerge later in the year.
View related analysis:
- Nasdaq 100 Outlook: Broadcom Extends Slide, Palantir Reversal Signal
- Nasdaq 100 Grinds Higher, AMZN, AMD, TSLA Show Reversal Risks
- Nasdaq 100 Leads Wall Street, Meta Bounce Gains Traction
- Nasdaq 100 Lags Dow Jones: Divergent Signals Among Nvidia, Apple, Meta
- Dead Cat Bounce Explained: How False Rallies Form in Downtrends
2026 Base Case: Nasdaq Correction Before Trend Resumption
- A Nasdaq 100 correction in 2026 is more likely to be earnings-led than macro-driven, with Q1 and Q3 posing the highest risk as AI expectations collide with delivery timelines.
- Historical drawdowns suggest a 5–10% pullback is the most probable outcome, with a smaller but non-trivial risk of a deeper 10–20% correction in the event of sharper earnings disappointment.
- Breadth has improved beneath the surface, but rising NGX/NDX signals point to a maturing, late-cycle rally rather than a fresh acceleration phase.
- Index direction remains highly dependent on a narrow group of mega-cap stocks, where any loss of leadership could exert an outsized drag on the Nasdaq 100.

Nasdaq 100 Correction Risk After a Prolonged Uptrend
Love it or loathe it, the long-term chart of the Nasdaq shows the index remains in a secular uptrend, albeit one punctuated by periodic drawdowns and sharp sell-offs. There are no extreme readings from longer-term breadth indicators, such as the percentage of stocks trading above their 50- and 200-month moving averages.
While weekly price action has become increasingly choppy and hints at the development of an ABC-style correction, there is little evidence to suggest a major secular top is forming in the absence of a genuine black swan event.
Ultimately, I expect dips to continue to be bought through 2026, allowing the broader bullish trend to reassert itself and push to new highs by year end.
That said, the Nasdaq 100 may already be entering — or be close to entering — a more meaningful corrective phase.
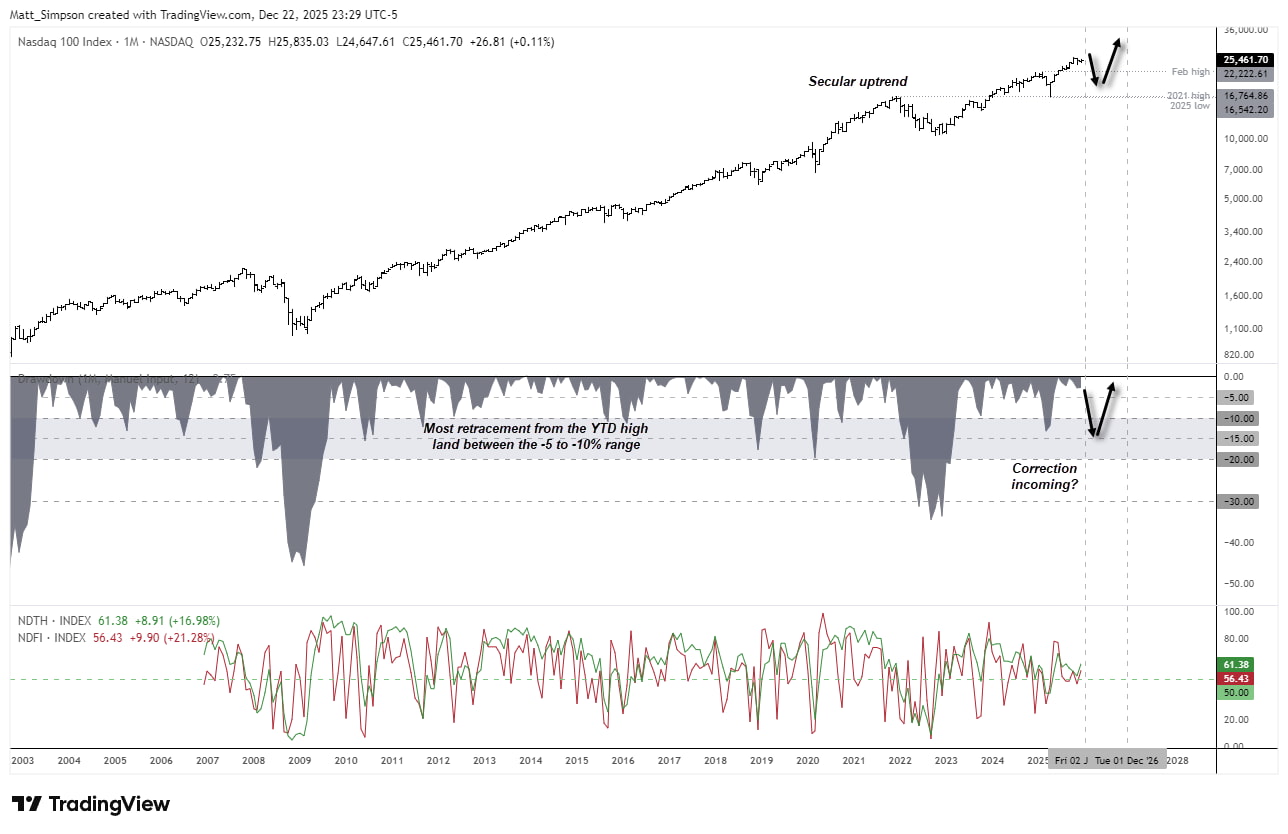
Chart analysis by Matt Simpson, Source: TradingView, Nasdaq
10–20% Retracement Risk: What History Suggests
The lower indicator shows the percentage drawdown from the prior 12-month high, helping to distinguish major sell-offs from more routine corrections while also highlighting their frequency. Unsurprisingly, the largest declines occurred during the dot-com bust, but the focus here is on smaller pullbacks, which are statistically far more common.
Since 2003, the vast majority of Nasdaq corrections have been less than 10%. Only thirteen have exceeded 10%, and just two extended beyond 20%. Barring a major shock, this suggests any pullback in 2026 is more likely to fall in the 5–10% range, with a smaller risk of a deeper 10–20% correction.
Nasdaq 100 Technical Analysis: Key Correction Levels
The weekly chart suggests an ABC-style correction may already be underway. Retracement levels have been plotted using December’s current high as the assumed year-to-date peak, helping identify areas where any pullback could stall.
Notably, the February high aligns closely with the 38.2% Fibonacci retracement, sitting just below the 10% drawdown zone. This places the ~22,300 area as a plausible near-term target for bears, or a zone where bulls may look to buy dips later in the year.
In the event of a sharper sell-off, a deeper correction of around 20% would bring prices towards the 50–61.8% Fibonacci retracement zone, clustered just above the 20,000 level.
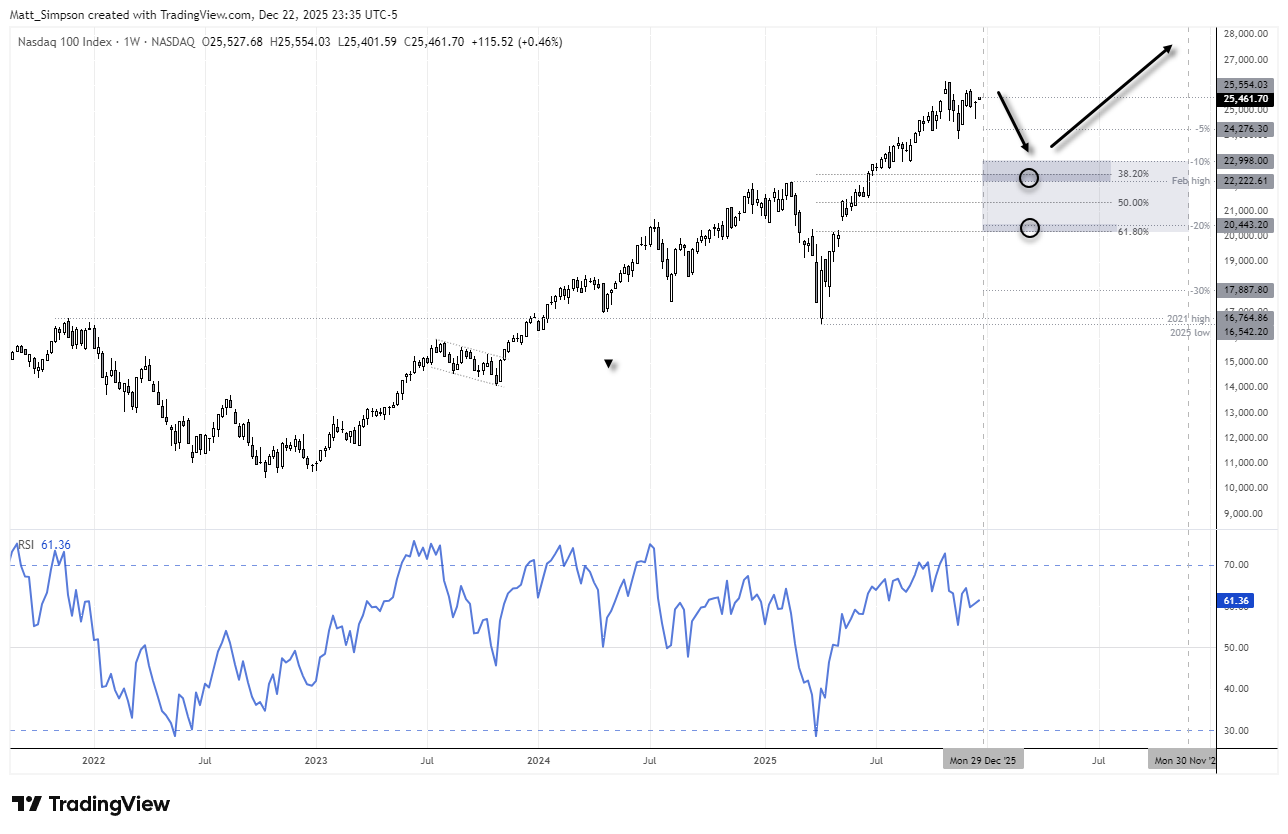
Chart analysis by Matt Simpson, Source: TradingView, Nasdaq

Breadth Signals a Maturing Nasdaq 100 Rally
The Nasdaq 100 Next Generation Index (NGX) tracks the next tier of technology companies that sit just below the top 100 by market capitalisation. Notably, the NGX is trading at record highs ahead of the Tech 100, while the NGX/NDX ratio has started to turn higher — a combination that often appears during the later stages of an equity rally.
The NGX/NDX ratio formed a prominent trough in July 2024 and has since carved out a double bottom and higher lows through H2 2025. While this does not necessarily signal an imminent downturn for the Nasdaq 100, it does suggest the index is no longer the clear leader, pointing instead to a loss of momentum and a maturing, late-cycle expansion.
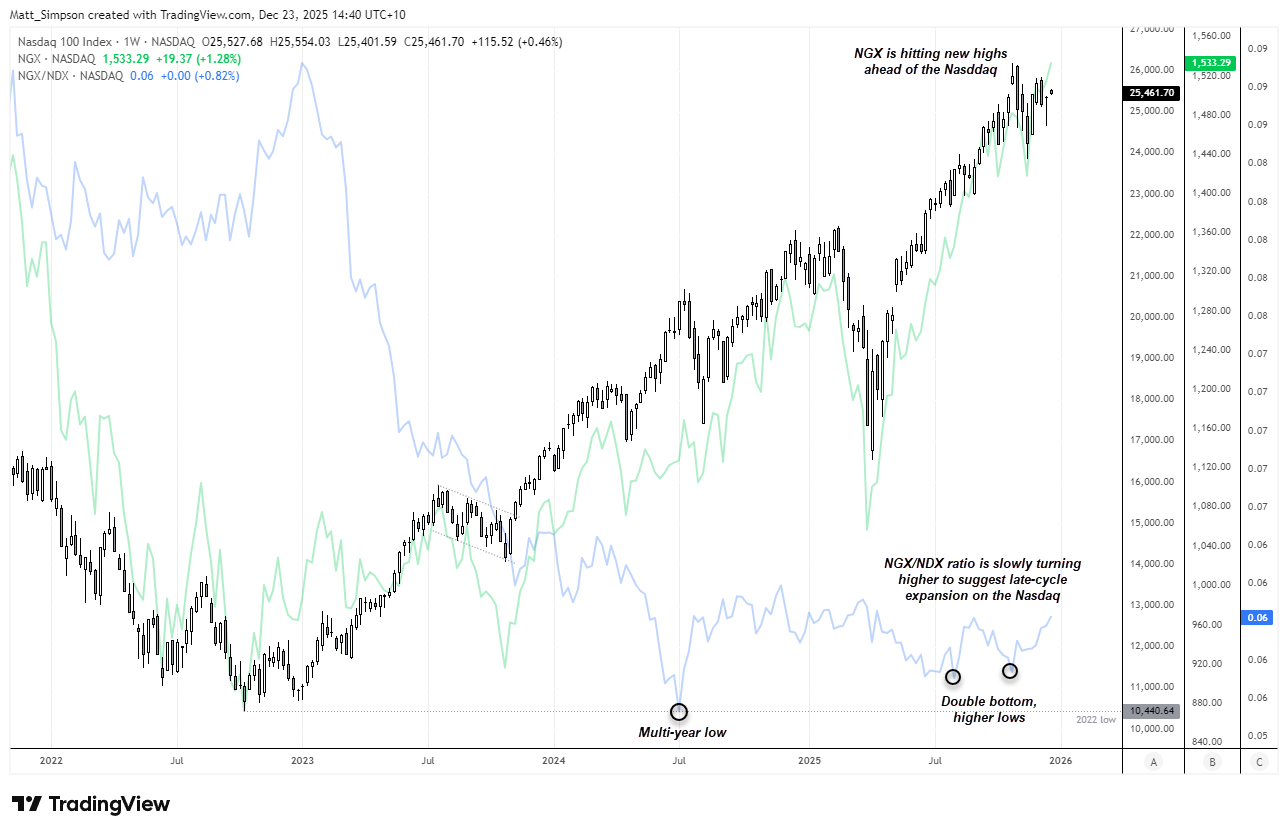
Chart analysis by Matt Simpson, Source: TradingView, Nasdaq
Nasdaq Q4 Earnings Season Is One to Watch
Q1 looks a potential hotspot for optimism to be challenged, as it coincides with full-year guidance resets. By early 2026, AI investment cycles will be well understood, while monetisation remains uneven. That creates a scenario where companies can beat near-term earnings yet still disappoint on outlook.
With valuations still elevated early in the year, even cautious guidance revisions could trigger analyst downgrades, rotation out of crowded AI leaders, and a broader Nasdaq pullback. Historically, this is when expectations adjust fastest — and most painfully.
Ultimately, the Nasdaq does not need earnings misses to trigger a sell-off; softer guidance alone may suffice. While breadth has improved beneath the surface, Nasdaq direction in 2026 remains highly dependent on a narrow group of mega-cap stocks
Nasdaq 100 Outlook: Mega-Cap Stocks Driving Index Direction
The Nasdaq 100 remains dominated by a small group of mega-cap stocks that continue to dictate index direction. However, with several of these leaders now showing late-cycle technical signals, any loss of momentum at the top could have an outsized impact on the index — even as broader participation improves beneath the surface.
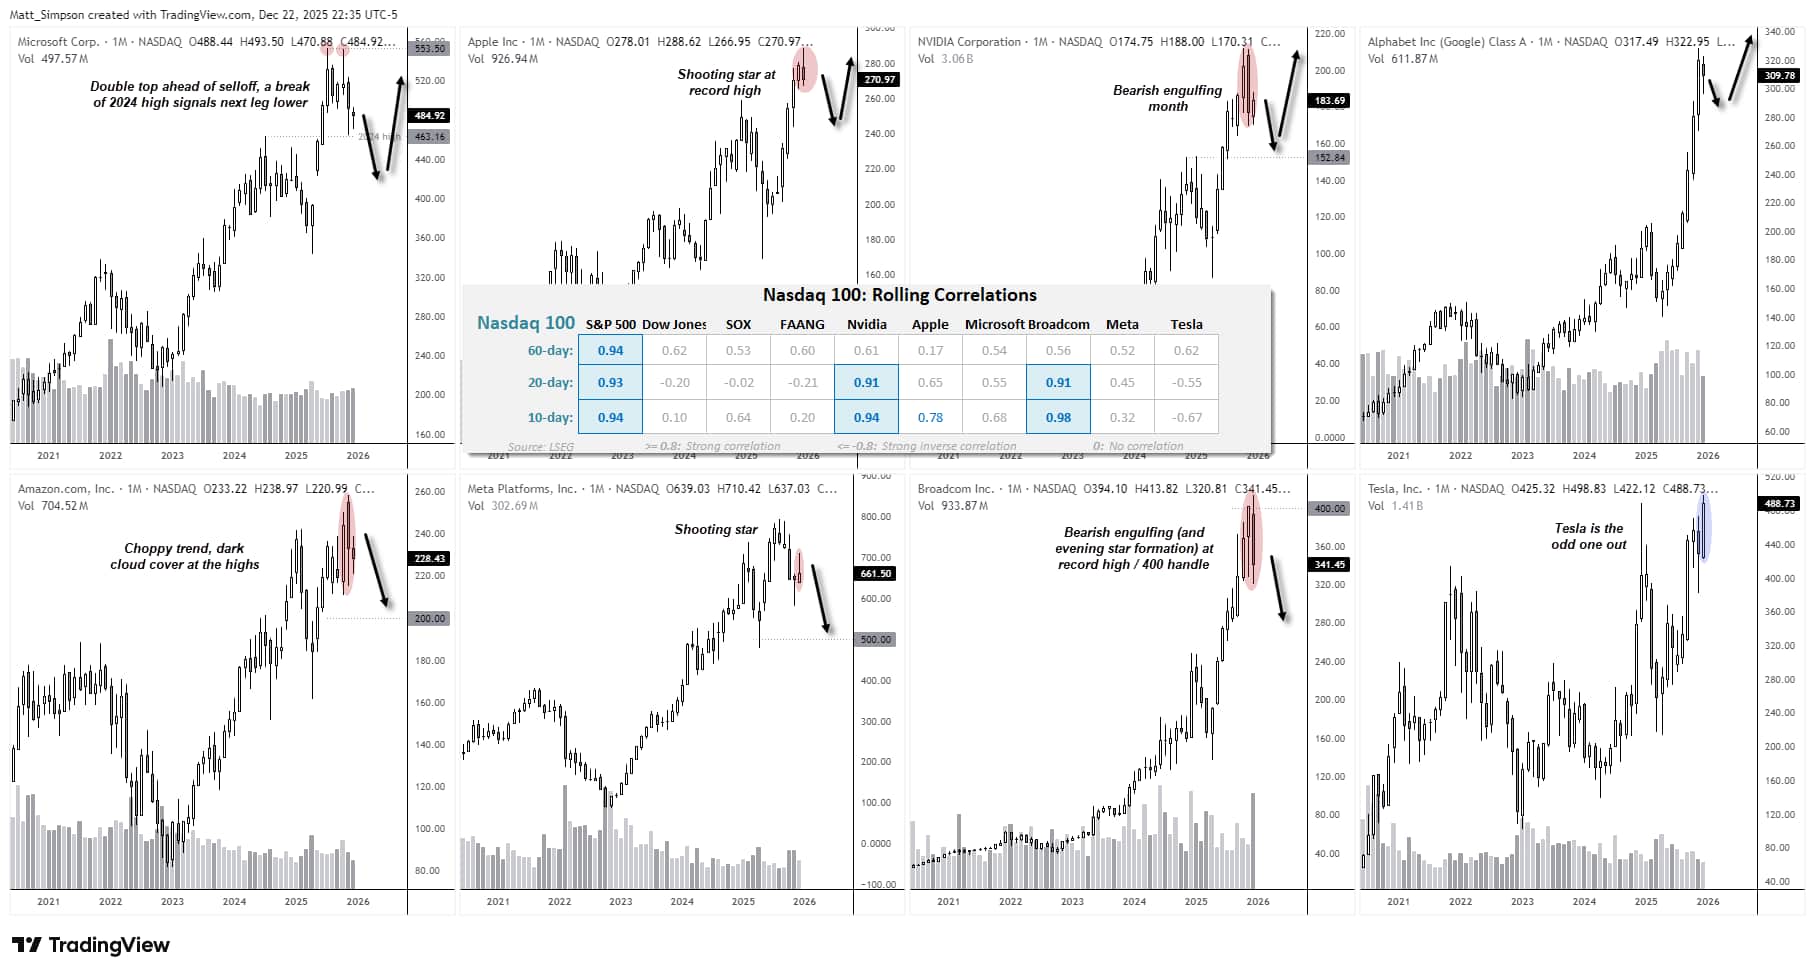
Chart analysis by Matt Simpson, Source: TradingView, NYSE
Microsoft (MSFT) – Nasdaq Leadership at Risk?
A potential double top has formed on Microsoft’s monthly chart at record highs, with the second peak marked by a shooting star reversal. A bearish engulfing candle followed in November, while December printed an inside month. A break below the 2024 high would signal scope for a deeper pullback and raise broader concerns for the wider technology sector, given Microsoft’s outsized influence on the Nasdaq 100.
Key earnings dates for MSFT:
- Q4 2025: late January 2026
- Q1 2026: late April 2026
- Q2 2026: late July 2026
- Q3 2026: late October 2026
Apple (AAPL) – Defensive Leader Losing Momentum
Apple’s share price has benefited from its decision to scale back AI investment at a time when investors are increasingly questioning sector-wide valuations. However, after a six-month rally, Apple printed a shooting star on the monthly chart in December near record highs. Volume has also been trending lower, suggesting a gradual deterioration in investor participation despite rising prices.
Key earnings dates for AAPL (expected):
- Q4 2025: early February 2026
- Q1 2026: early May 2026
- Q2 2026: late July / early August 2026
- Q3 2026: early November 2026
NVIDIA (NVDA) – AI Momentum Under Scrutiny
Nvidia continues to attract scrutiny around valuation and positioning following its outsized rally. While the longer-term trend remains intact, the pace of gains suggests a meaningful pullback would not be unusual. Prices have continued to rise even as volumes trend lower, while November’s bearish engulfing candle — despite lacking a volume spike — highlights elevated volatility at record highs after an extended move. That combination warrants caution for bulls and Nasdaq traders alike.
Key earnings dates for NVDA (expected):
- Q4 2025: mid–late February 2026
- Q1 2026: late May 2026
- Q2 2026: late August 2026
- Q3 2026: mid–late November 2026
Alphabet (GOOGL) – Consolidation Risk After Strong Run
This is not a stock I would personally look to short, but I would be wary of being too aggressively long after such a strong rally. Alphabet advanced for eight consecutive months into its November record high before printing a bearish inside month in December. The subdued volumes during December suggest this may simply represent a pause within the broader uptrend rather than a decisive reversal signal. Even so, it adds to a growing list of Nasdaq mega-cap stocks hinting at potential weakness, at least through the first quarter.
Key earnings dates for GOOGL:
- Q4 2025: late January / early February 2026
- Q1 2026: late April 2026
- Q2 2026: late July 2026
- Q3 2026: late October 2026
Amazon (AMZN) – Rally Vulnerable to Fading
Amazon has recently been on my short watchlist, although without a broader market downturn it appears unlikely to break decisively below 200 in the near term. Price action has turned choppy, and the stock failed to convincingly clear its February high when it rallied in October. A two-bar bearish reversal (dark cloud cover) formed in November, leaving a bias for rallies to be faded, at least towards the 200 area.
Key earnings dates for AMZN:
- Q4 2025: early February 2026
- Q1 2026: late April / early May 2026
- Q2 2026: late July 2026
- Q3 2026: late October 2026
Meta Platforms (META) – Momentum Fades at Highs
While Meta had previously been on my long watchlist, bearish momentum returned once prices reached my bullish target near 700. A shooting star has since formed on the monthly chart, increasing the risk of at least one further leg lower, particularly if broader Nasdaq momentum continues to cool.
Key earnings dates for META:
- Q4 2025: late January / early February 2026
- Q1 2026: late April 2026
- Q2 2026: late July 2026
- Q3 2026: late October 2026
Broadcom (AVGO) – Key Nasdaq Correlation Warning
Broadcom shows one of the strongest correlations with the Nasdaq among AI-related stocks, making its price action particularly important. The stock printed a bearish outside month in December on elevated volume, signalling a meaningful shift in sentiment towards sellers. Should Broadcom struggle in 2026, it would raise broader concerns for the Nasdaq 100’s resilience.
Key earnings dates for Broadcom:
- Q4 2025: early March 2026
- Q1 2026: early June 2026
- Q2 2026: early September 2026
- Q3 2026: early December 2026
Tesla (TSLA) – Speculative Sentiment Barometer
Tesla stands out as the only stock in this group to close at a record high in December on the monthly chart. If there is cause for caution, it lies in the fact that the rally from the April low occurred alongside declining volume. Prices have only marginally traded above the 2024 high, while 500 now looms as a key resistance level.
Key earnings dates for Tesla:
- Q4 2025: late January 2026
- Q1 2026: mid–late April 2026
- Q2 2026: late July 2026
- Q3 2026: mid–late October 2026
View the full economic calendar
-- Written by Matt Simpson
Follow Matt on Twitter @cLeverEdge
How to trade with City Index
You can trade with City Index by following these four easy steps:
- Open an account, or log in if you’re already a customer
• Open an account in the UK
• Open an account in Australia
• Open an account in Singapore
- Search for the market you want to trade in our award-winning platform
- Choose your position and size, and your stop and limit levels
- Place the trade


