
The US dollar rally lost momentum as markets swung from panic to cautious optimism over the Iran conflict. Oil prices initially surged amid fears of supply disruptions through the Strait of Hormuz before reversing sharply as traders began pricing in the possibility that the conflict could be shorter than feared.
Safe-haven demand had earlier lifted the US dollar and USD/JPY, but fading geopolitical risk and a rebound in risk appetite helped stall both rallies. With oil volatility easing, traders are now shifting their focus back to macro drivers such as US inflation data and Federal Reserve policy expectations, with CPI and PCE reports looming after last week’s softer-than-expected Nonfarm Payrolls.
View related analysis:
- FX Futures Positioning: USD, EUR, GBP, JPY, AUD | COT report
- Wall Street Futures Feel the Heat of Crude Oil Surge
- Australian Dollar Outlook: Options Price Downside Risk Yet AUD/USD Holds Firm
- ASX 200 Outlook: Oil, Yields and Global Equities Drive Market Risk
US Dollar and USD/JPY Rallies Stall as Markets Price Out Worst-Case Iran War Scenario
It was a turbulent start to the week to say the least. Crude oil prices initially surged more than 30%, dragging Wall Street futures sharply lower alongside gold and silver, before the moves almost fully reversed on headlines that the war with Iran “could be over soon”, according to President Trump. As usual, the comments came without details, leaving markets wondering whether there is actually anything to follow – or if this is another “mission accomplished” moment.
The U.S. and its allies have struck a range of Iranian military targets, oil infrastructure and command centres – and reportedly killed Iran’s Supreme Leader, Ali Khamenei. Yet beyond the military damage, it is not obvious that anything structurally has changed.
There has been no regime collapse, and Iran’s political system appears to be continuing under new leadership, with Mojtaba Khamenei – Ali’s son – stepping into the power vacuum. Unless some form of deal has been reached behind closed doors, there has been no regime change and no sign of the Iranian population being “liberated”.
For markets, the key takeaway is that traders quickly priced out the worst-case scenario of a prolonged disruption to oil flows through the Strait of Hormuz. But without clarity on what has actually been achieved, the geopolitical risk premium may prove fragile.
Source: LSEG
Despite my reservations, appetite for risk returned late in the US session.
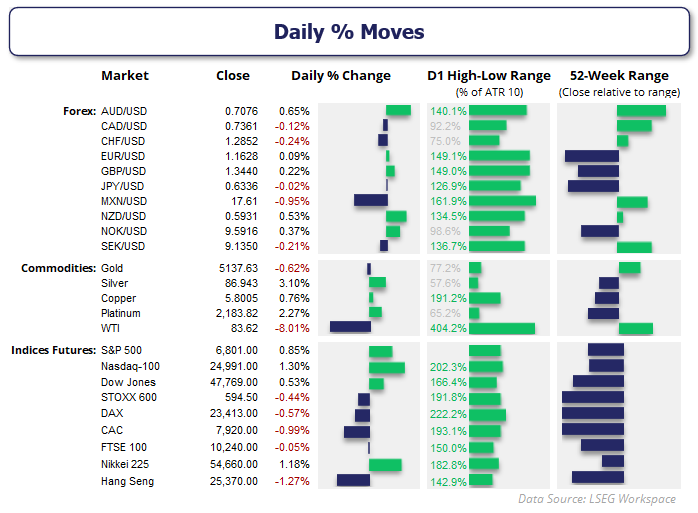
- The Nasdaq 100 led Wall Street higher, rising 1.3% and closing just shy of 25,000
- S&P 500 recouped 0.85% and formed a prominent bullish outside day, closing just shy of 6800
- Dow Jones also formed a bullish outside day, though it only closed the day 0.5%
- Daily ranges across Wall Street were in excess of 200% their 10-day ATR (average true range)
- SPI 200 (ASX 200 futures) were up 2.15%, paving the way for a large gap higher for the cash market today

US Dollar Index (DXY) Technical Analysis
The US dollar has been the main beneficiary of safe-haven flows from currency traders. Recent commitment of traders (COT) data also backed up what price action over the past week has shown, with large speculators flipping to net-short yen futures and asset managers moving to net-long exposure on the US dollar index.
While it looked like the USD index was heading for 100 yesterday, its rally stalled at 99.70 and the session closed with a bearish outside day. Given the choppy range of the past five days and the lack of meaningful bullish follow-through, I am leaning towards an interim high for the US dollar and at least a minor pullback.
The depth of any pullback may be dictated by the actual ‘success’ of the US strikes on Iran. But if the war moves into the rear-view mirror, it allows traders to refocus on economic data — such as last week’s NFP miss and this week’s CPI and PCE inflation reports. Any hint of weakness could rekindle hopes of a Fed cut and weigh further on the greenback, at least over the near term.
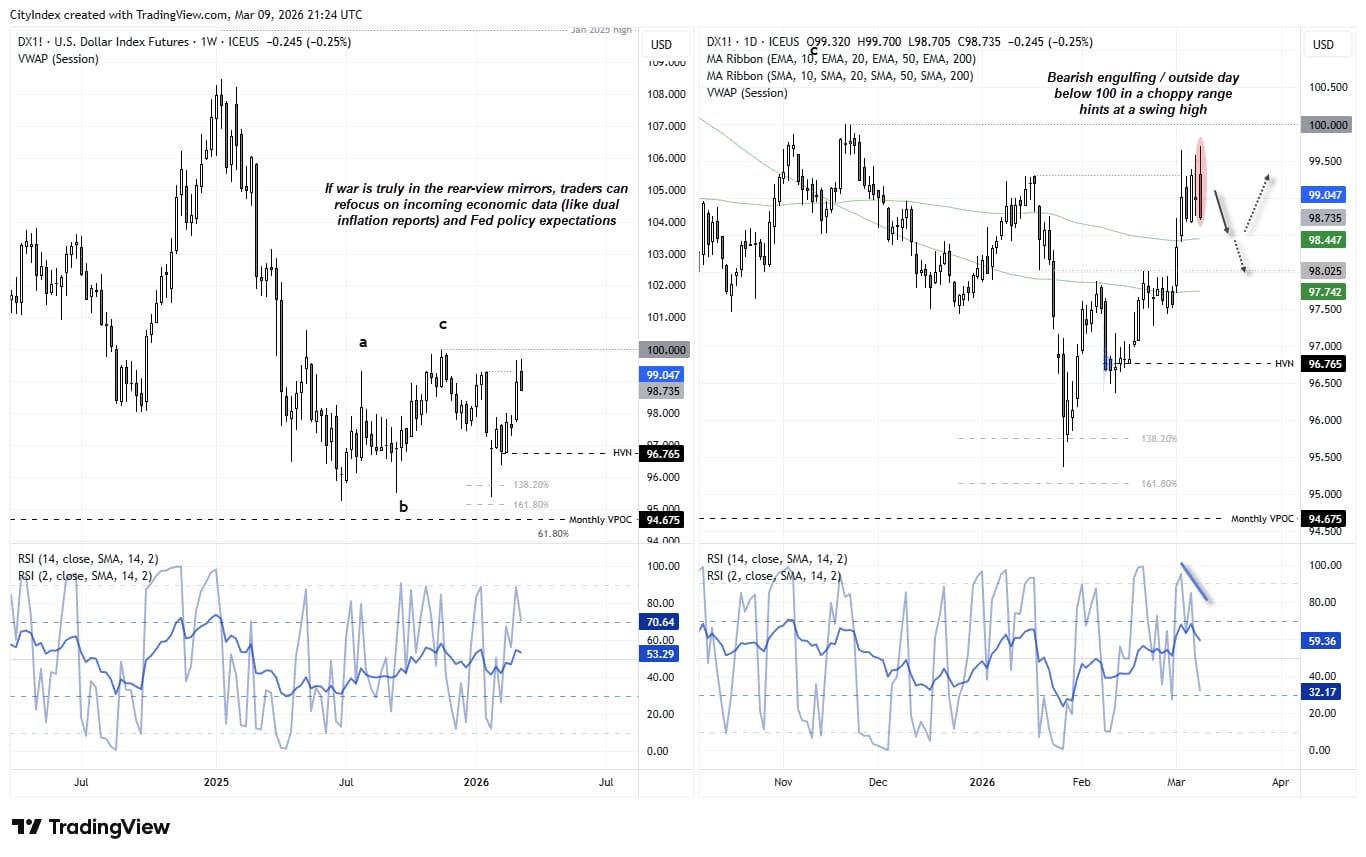
Source: ICE, TradingView

USD/JPY Technical Analysis: US Dollar vs Japanese Yen
A prominent shooting star candle has formed on the USD/JPY daily chart around a resistance cluster, warning of a near-term top. The daily high respected the 2025 high as resistance, and the session closed back below the monthly R1 pivot and last week’s high.
A minor bearish divergence has also formed on the RSI (2), though it is worth remembering that we’re comparing the RSI to closing prices and not the highs — something that sometimes catches people out.
Bears could seek to fade moves within Monday’s range with an initial move towards 157 in mind, a break beneath which brings the 156.44 low into focus. Should the war in Iran be confirmed as over and US inflation reports surprise to the downside, perhaps a deeper pullback could be considered. Though for now this is not the base case.
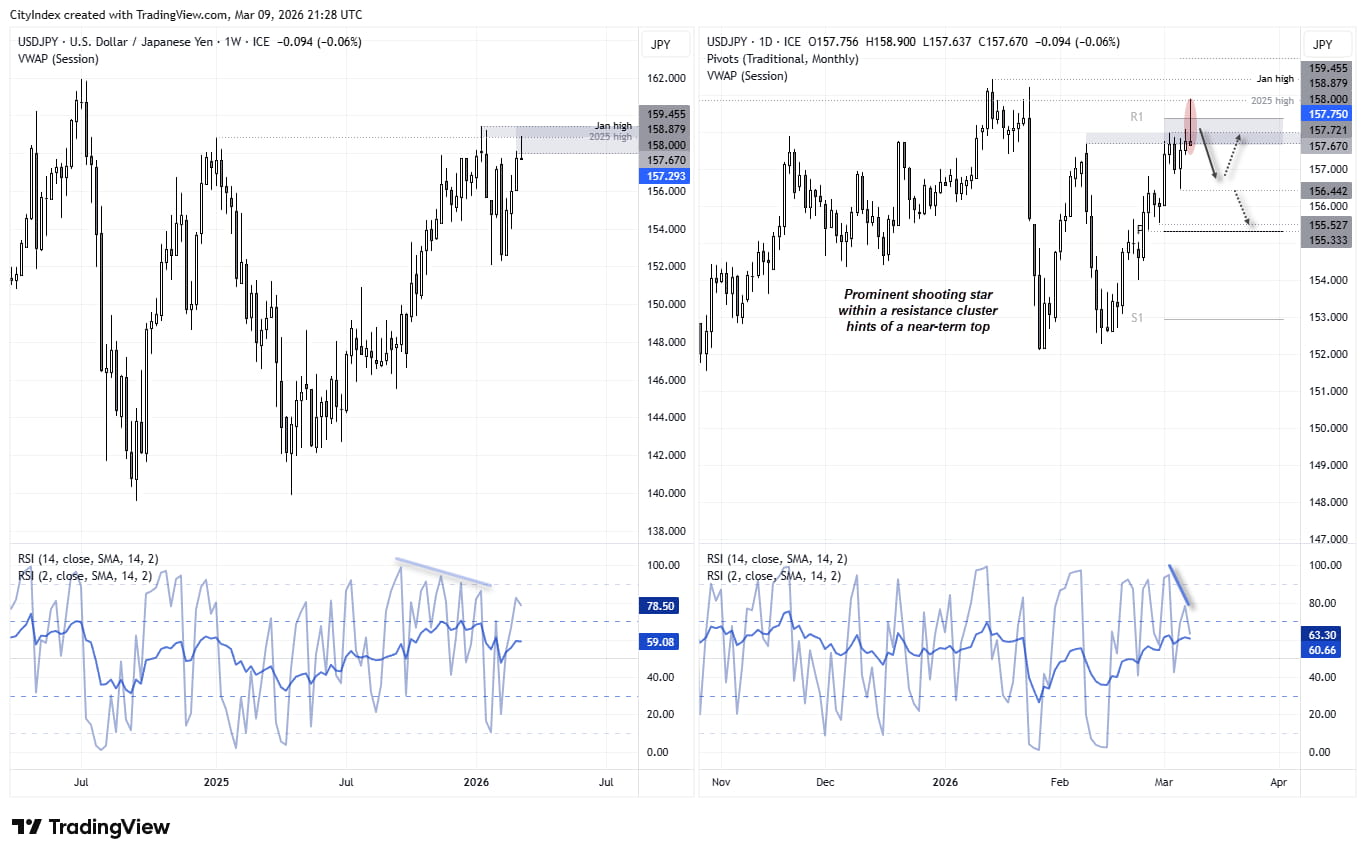
Source: ICE, TradingView
View the full economic calendar-- Written by Matt Simpson
Follow Matt on Twitter @cLeverEdge
How to trade with City Index
You can trade with City Index by following these four easy steps:
- Open an account, or log in if you’re already a customer
• Open an account in the UK
• Open an account in Australia
• Open an account in Singapore
- Search for the market you want to trade in our award-winning platform
- Choose your position and size, and your stop and limit levels
- Place the trade