


The US dollar’s latest rebound continues to look corrective rather than the start of a broader trend reversal. Despite failing to close above key resistance levels, the greenback has shown resilience, holding support near its 50-day EMA.
With the weekly RSI still below 50, the dollar’s upside may be capped, but short-term momentum could strengthen as US data are backfilled following the government shutdown. This could see EUR/USD and GBP/USD come under renewed pressure if the dollar bounce gains traction.
View related analysis:
- British Pound Price Action Setups: GBP/USD, GBP/JPY
- US Dollar, Yields Lower After Powell Comments, GBP/USD Holds Ground
- Australian Dollar Outlook: AUD/USD Bulls Reclaim 200-Day, US CPI Looms
- Nasdaq 100, S&P 500, Dow Jones Outlook: Has The Dead Cat Bounced?
- AUD/USD Q4 Outlook: Bears Target Slower Growth, RBA Cut
US Dollar Strength Could Limit Upside for EUR/USD and GBP/USD
US Dollar Technical Outlook
I’ve outlined in several recent articles that the current rebound in the US dollar appears to be a corrective move against its decline from the January high to the June low. For now, I expect this correction to terminate below the August high, which itself sits beneath the 100 handle.
Last week’s bearish inside candle marked the second consecutive week the US dollar index failed to close above the 200-week EMA, and the fifth straight week of alternating candle colours – a hallmark of corrective price action.
With the weekly RSI still below 50, it’s possible the corrective high is already in place. However, volatility could increase in either direction as US economic data are backfilled once the government shutdown is presumably resolved.
That said, I see potential for a short-term bounce in the US dollar index, given it held above the 50-day EMA and the 98 handle on Friday. The daily RSI (2) dipped into oversold territory, while the RSI (14) remains above 50 – a combination that favours the bears in the near term, and poses headwinds for GBP/USD and EUR/USD.

Chart analysis by Matt Simpson - data source: TradingView U.S. Dollar Index Futures (DX1!)

EUR/USD Technical Analysis: Euro vs US Dollar
The daily chart shows that EUR/USD snapped a 3-day rally on Friday, closing the day back beneath the 20 and 50-day day EMAs. The bearish day also marks the second candle of a 2-bar bearish reversal (dark cloud cover) to warn of a near-term dip.
I’m not looking for a particularly deep pullback on EUR/USD, but bulls could seek dips towards the 1.16 handle in anticipation of a higher low above last week’s lows. However. A high-volume node (HVN) sits around 1.1622 on the 1-hour chart. Also note the monthly S1 pivot point (1.1582) and 100-day EMA (1.1580) for additional support if needed. The monthly pivot point (1.1753) and 1.1779 high makes a viable upside target for bulls.
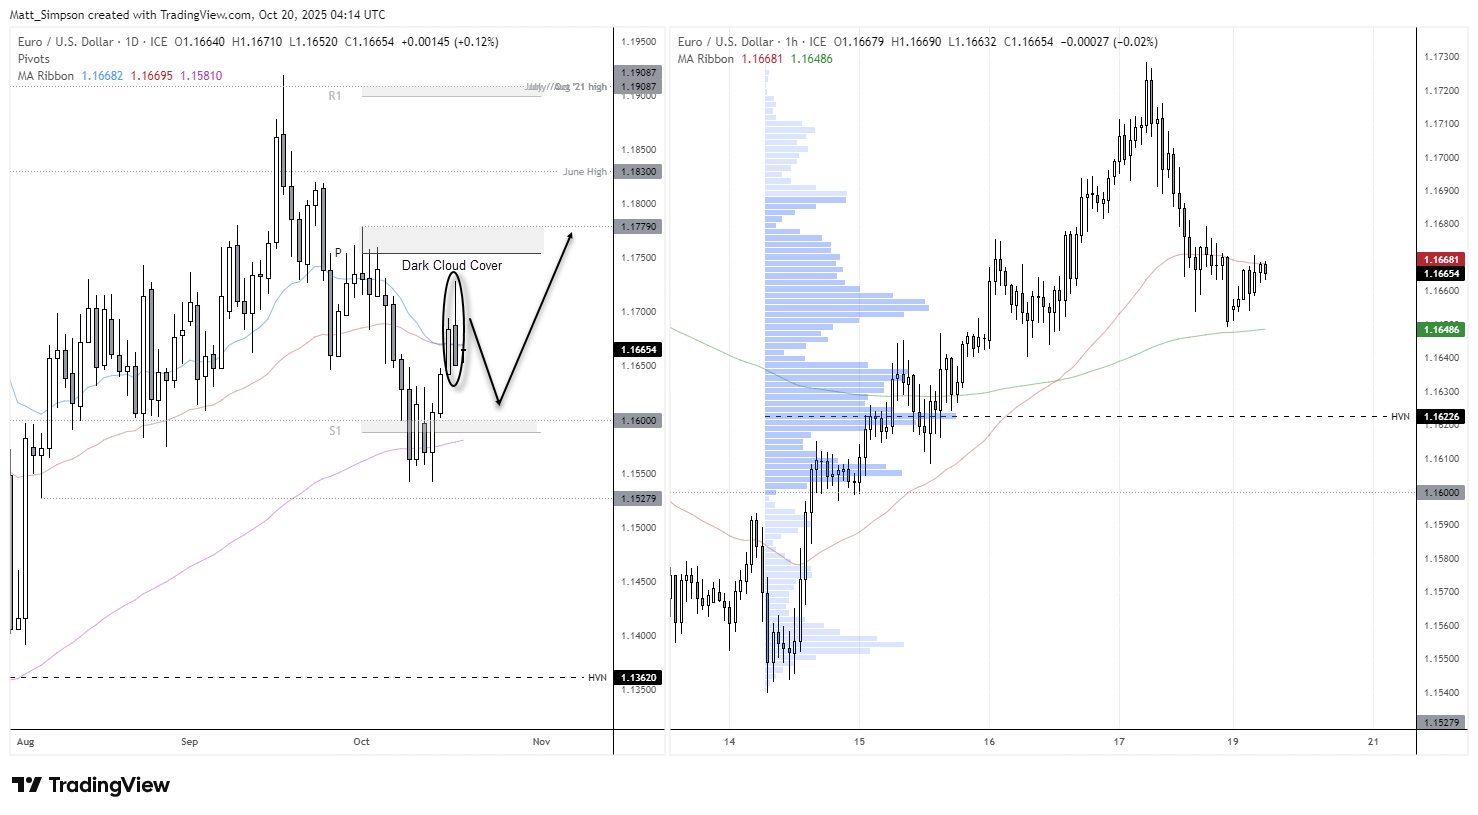
Chart analysis by Matt Simpson - data source: TradingView EUR/USD

GBP/USD Technical Analysis: British Pound vs US Dollar
Last week’s bias for a rebound from the 200-day EMA towards the lower VPOC played out well, with GBP/USD reaching the downside objective on Thursday before forming a doji (indecision candle) on Friday. While this could point towards a potential pullback for the British pound, the strength of last week’s advance suggests any retracement may be shallower than that seen in EUR/USD. In turn, this suggests EUR/GBP could trade lower this week if these assumption prove to be correct.
It’s also worth noting that much of the buying volume occurred in the upper half of the rally, which again implies that any dip could be limited.
GBP/USD bulls may look for opportunities to buy dips towards Friday’s low while maintaining a near-term bullish bias, provided prices hold above the weekly pivot point at 1.3381. Upside targets include the September VPOC at 1.3516, which aligns closely with the weekly R1 pivot level.
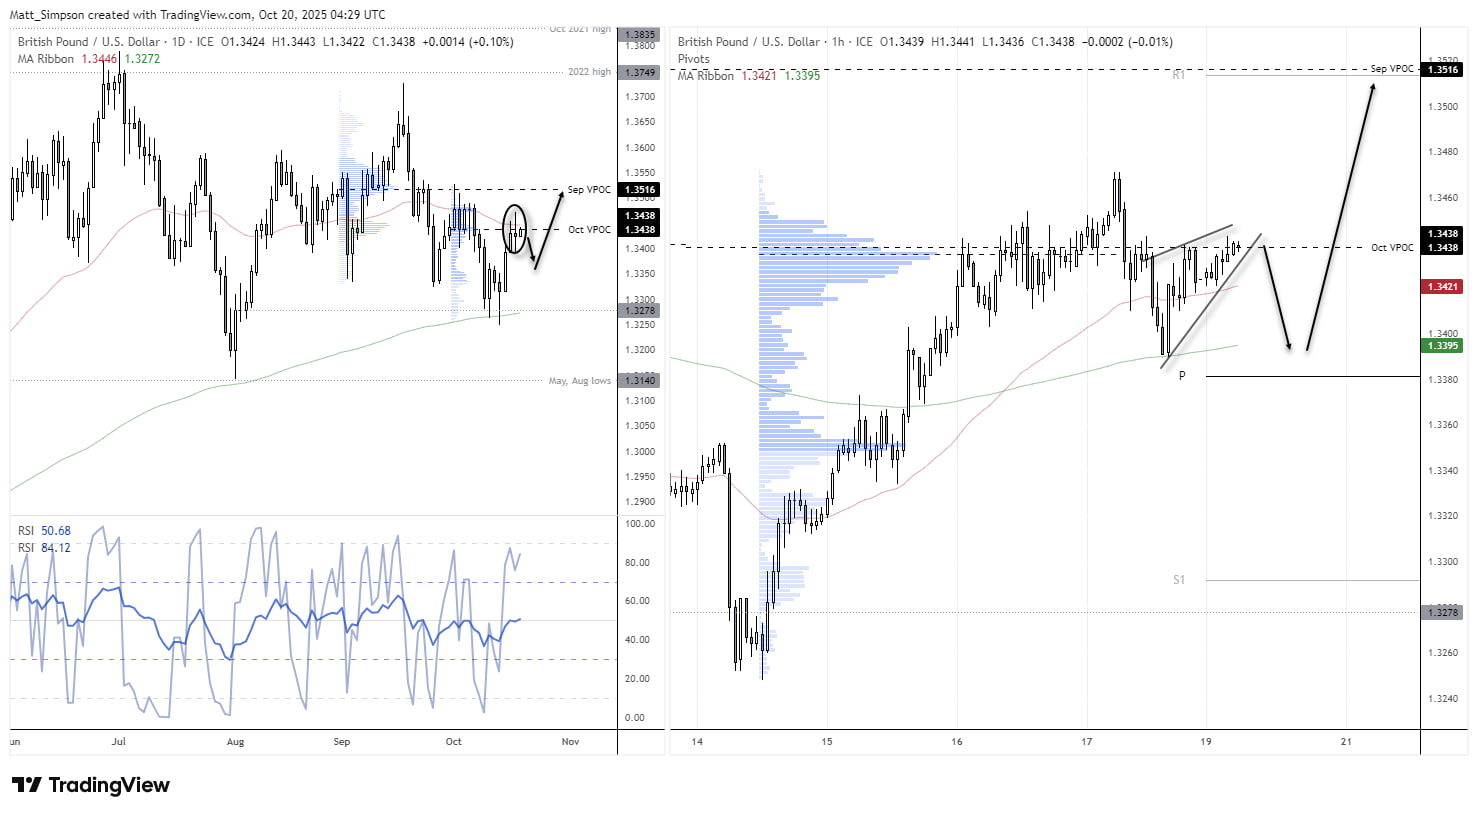
Chart analysis by Matt Simpson - data source: TradingView GBP/USD
View the full economic calendar
-- Written by Matt Simpson
Follow Matt on Twitter @cLeverEdge
How to trade with City Index
You can trade with City Index by following these four easy steps:
- Open an account, or log in if you’re already a customer
• Open an account in the UK
• Open an account in Australia
• Open an account in Singapore
- Search for the market you want to trade in our award-winning platform
- Choose your position and size, and your stop and limit levels
- Place the trade


