


The US dollar has surged this week, bringing the psychologically important 100 level on the US Dollar Index (DXY) back into focus. A positioning extreme in futures markets had already hinted that a sharp move could unfold, and geopolitics appears to have provided the catalyst.
While the broader setup suggests the dollar may ultimately attempt to reclaim 100, several FX majors are already hinting at a near-term retracement. Technical signals from EUR/USD and USD/CAD suggest the rally could pause before the next directional move takes shape.
View related analysis:
- US Dollar Outlook: DXY Hints at a Swing High, but COT Signals Diverge
- FX Futures Positioning: US Dollar, EUR/USD, GBP/USD | COT report
- AUD/JPY Rattled at 35-Year High, Gold Probes 5000 as Volatility Spikes
- Bitcoin Outlook: It Could Be Now or Never for a BTC Bounce
US Dollar Eyes 100, Though EUR/USD and USD/CAD Warn of Pullback
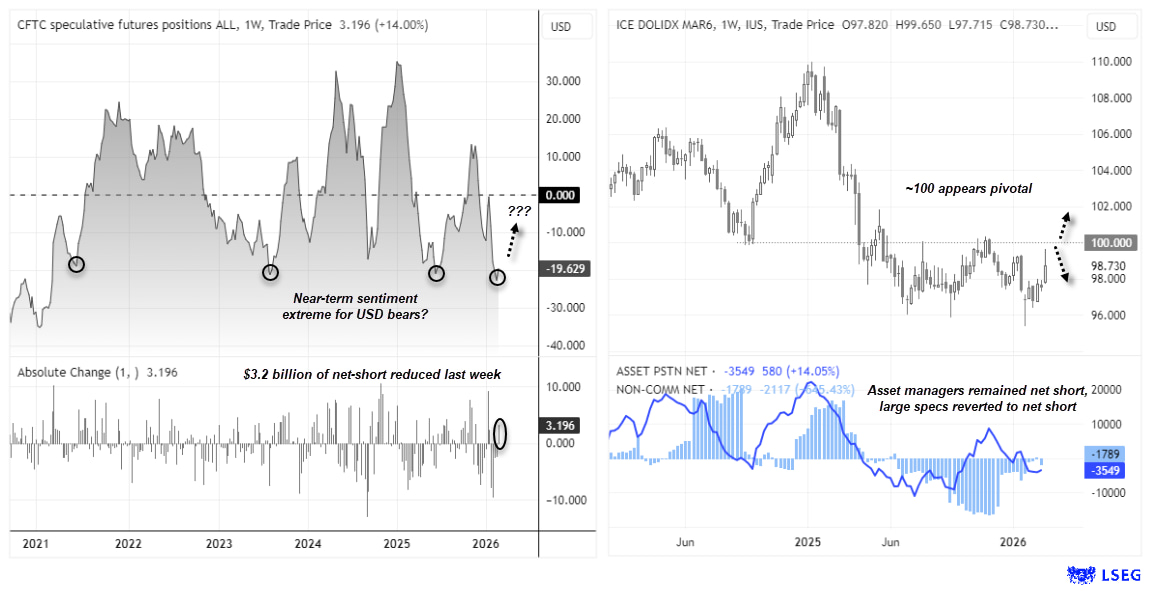
I noted the potential for a USD sentiment extreme in recent COT reports, with collective net-short exposure to the dollar in the futures market reaching a five-year high two weeks ago. A further $3.2 billion of net-short exposure was trimmed last week, ahead of this week’s geopolitically driven rally. I cannot claim to have predicted the reason for the rally, but the clues were there for its potential.
If tensions in the Middle East remain elevated and US data continues to quash hopes of even a single Fed cut this year, the dollar could indeed have further to run, with a break back above 100 potentially on the cards. Though there are already clues for a retracement lower for USD over the near term.

Futures Traders Send Mixed Signals on the US Dollar
We should also consider the divergent views on the dollar among futures traders. Despite the overall bearish exposure, asset managers are only net-short the US Dollar Index by around 3.5k contracts. Large speculators are net-short by roughly 1.8k contracts and were net-long the week prior. The contrasting exposure levels muddy the waters somewhat, as we would typically expect speculative positioning to sit further from neutral if conviction were strong.
The 100 level is now within reach yet remains an obvious area of resistance, making it a pivotal level for the bullish or bearish narrative in the weeks ahead. While I suspect the dollar may at least attempt to reclaim 100, there are also clues pointing to a near-term pullback on the US Dollar Index and several major FX pairs.
Source: IMM, CFTC (COT), ICE, LSEG
EUR/USD Technical Analysis: Euro vs US Dollar
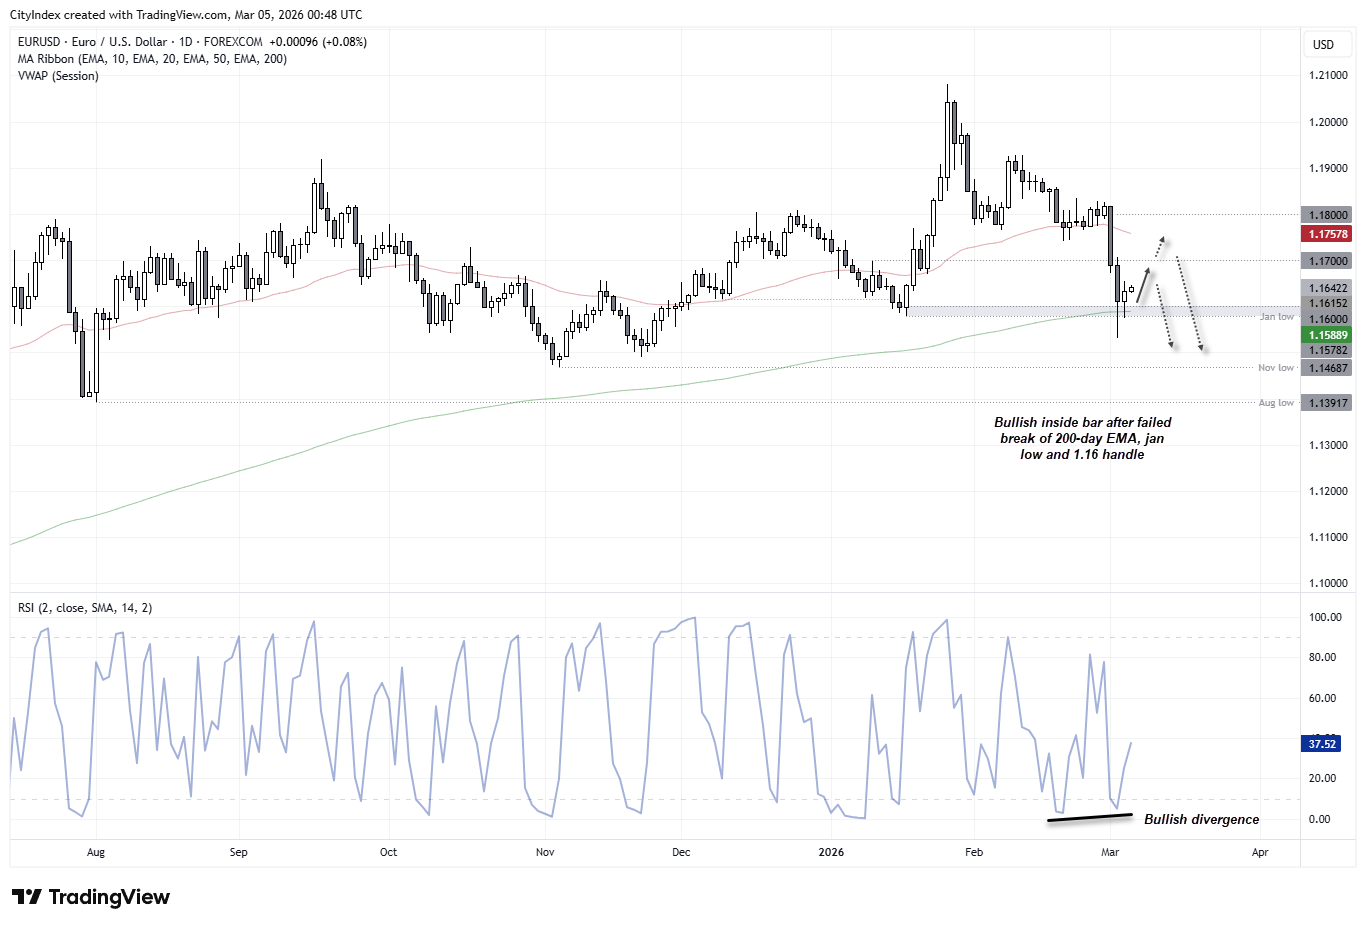
Perhaps the biggest clue comes from the euro, which makes sense given its 57% weighting in the US Dollar Index basket. While Tuesday marked the worst two-day plunge for EUR/USD in three years, it failed to close beneath the January low or the 200-day EMA near the 1.16 handle. A small bullish inside day formed above the 200-day EMA on Wednesday and momentum is now attempting to turn higher.
Bulls could seek dips towards the 200-day EMA in anticipation of a leg higher towards 1.17, a break above which brings the 50-day EMA into focus near 1.176. Conversely, a break below 1.16 would suggest the bearish move from ~1.21 is resuming — potentially coinciding with the US Dollar Index breaking above 100.
Source: Forex.com, TradingView

USD/CAD Technical Analysis: US Dollar vs Canadian Dollar
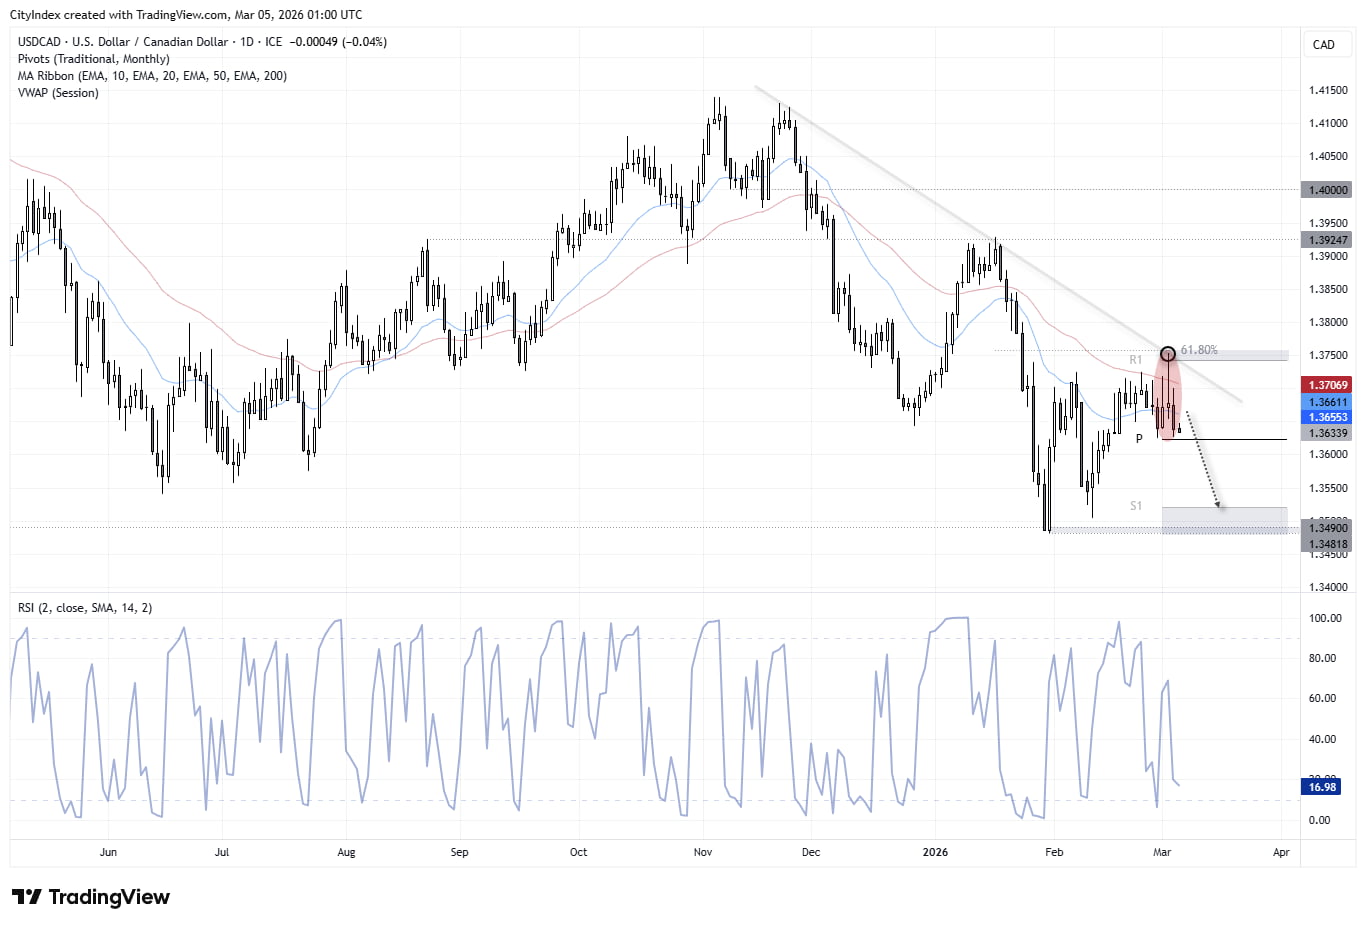
The Canadian dollar is gaining traction against the US dollar, with USD/CAD printing a shooting star candle on Monday, suggesting a swing high may be in place. Notably, the high of that candle respected the 61.8% Fibonacci retracement as resistance and closed the day beneath the 50-day EMA.
Wednesday’s bearish candle closed below the 20-day EMA and completes a three-bar bearish reversal (evening star) formation. Bears could look to fade retracements within Wednesday’s range in anticipation of a break beneath the monthly pivot point and this week’s low.
Source: ICE TradingView


