
The US dollar is showing renewed strength as DXY approaches a key breakout zone. Both EUR/USD and GBP/USD are testing support, while USD/JPY continues to rally after the Bank of Japan refrained from signalling imminent rate hikes. With the Fed resisting December cut expectations and crucial ISM data due next week, traders are preparing for a decisive move in the greenback.
View related analysis:
- US Dollar, Japanese Yen, New Zealand Dollar: COT Report Analysis
- US Dollar Dominates as Bears Run for Cover, Yields Surge
- US Dollar Leads FX Majors After Hawkish FOMC: USD/JPY, AUD/USD in Focus
- Gold Shows Tentative Signs Of Stability, Options Hint At Mild Recovery
DXY Nears Breakout Zone as Major Forex Pairs Test Key Levels
At the beginning of October, I outlined a case for the US dollar to extend its bounce from the 96 lows as part of a ‘wave C’ within an ABC correction. Initially, the bias was for wave C to terminate around 100, with the potential to extend towards 102 before reverting to its dominant bearish trend. Given the recent pickup in bullish momentum, perhaps wave C will prove deeper after all.
Jerome Powell pushed back against the idea of a 25bp cut in December at this week’s FOMC meeting, which caught many by surprise, given Fed funds futures were implying around a 90% chance of a Christmas cut beforehand. While US data remains limited due to the government shutdown, traders will be watching next week’s ISM reports closely — particularly the ‘prices paid’ and ‘employment’ sub-indices — as these could help shape expectations for Fed policy in December and the US dollar’s trajectory. The DXY now sits around a key resistance level heading into the weekend, making next week pivotal for the greenback’s direction.
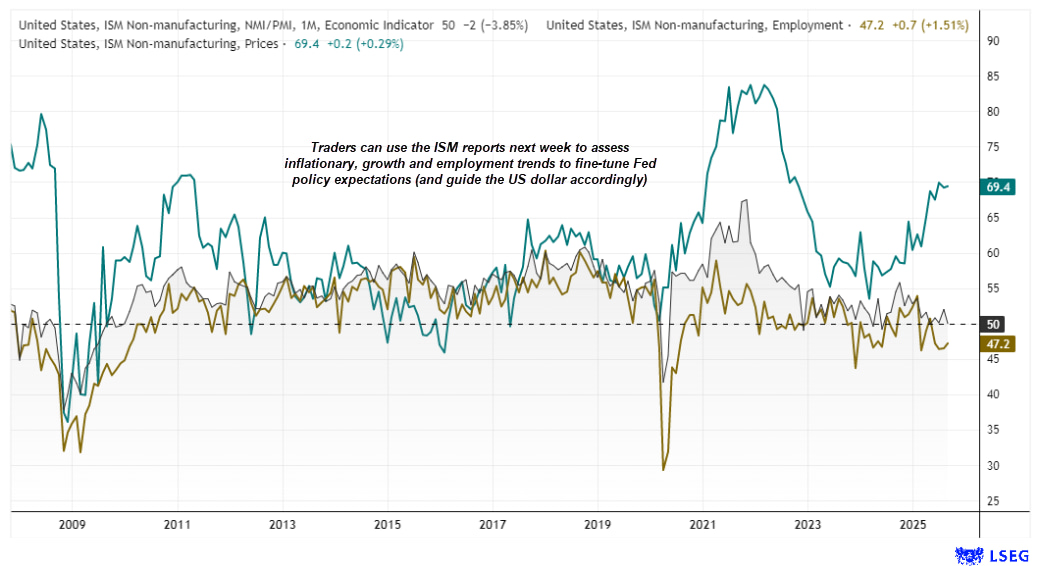
Chart prepared by Matt Simpson: Source – Institute for Supply Management (ISM, LSEG)

US Dollar Index (DXY) Technical Analysis
The US dollar index is on track to rise for a second consecutive month and form a morning star reversal pattern. While a break above the August high (99.67) would confirm this as a bullish reversal signal, traders may prefer to treat a sustained move above the 100 handle as confirmation. The May high (100.97) then comes into focus for bulls, while the 138.2% Fibonacci level (101.46), the 102 handle, and the 161.8% extension (102.42) also present potential upside targets.
As for the bigger picture, I suspect the US dollar will print new lows as we move into next year, as softer data allows the Fed to signal fresh rate cuts. A lower high formed in January (108.84), suggesting the broader trend remains bearish.
The rally from the July 2023 low (96.00) to the January high (108.84) appears corrective in nature, terminating with that lower high before momentum reversed sharply lower in an impulsive fashion. The core bias is that the dollar’s current rally represents an ABC correction against this year’s declines, and momentum is likely to revert lower once the current wave C completes.
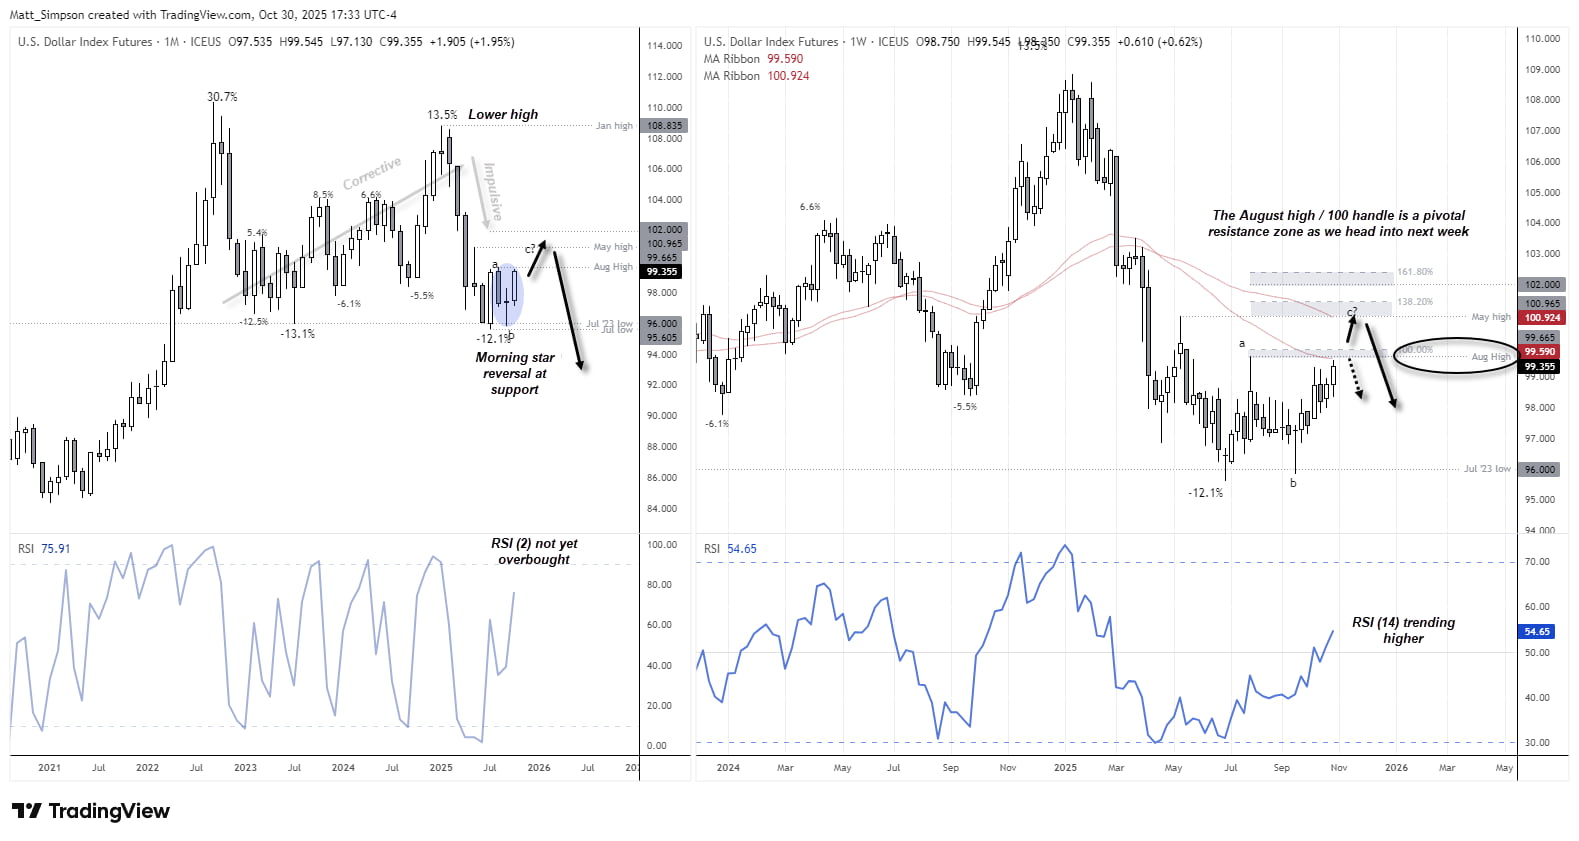
Chart analysis by Matt Simpson - data source: TradingView U.S. Dollar Index Futures

Major Forex Pairs Weaken as US Dollar Strengthens
With my bias for the US dollar to break higher initially, I’ll switch to the daily chart of forex majors to see how they stack up against the dollar’s dominance.
- EUR/USD is on the cusp of testing the October low (1.1542), though a break below 1.1528 is required to confirm a bearish breakout.
- GBP/USD has breached the August low but failed to follow through, suggesting a minor bounce may occur in the near term. However, an eventual downside break remains plausible unless US data weakens next week, which could bring the 1.30 handle into focus for pound bears.
- USD/CHF is back above 0.80 after forming a higher low on the daily chart, with bulls likely targeting a break of the October high (0.8076).
- USD/CAD saw clear bullish range expansion on Thursday and is attempting to break above 1.40, following a bullish hammer that perfectly respected its 200-day EMA. The bias favours a retest of the October high (1.4080).
- USD/JPY surged to an eight-month high after the Bank of Japan refrained from committing to an imminent rate hike at yesterday’s meeting.
- AUD/USD fell for a second day; however, as outlined in yesterday’s report, the pullback may be limited, with a move towards 0.67 still possible for the Australian dollar.
- NZD/USD also declined for a second session, with its daily trend structure remaining bearish and pointing towards 0.57, potentially lifting AUD/NZD in the near term.
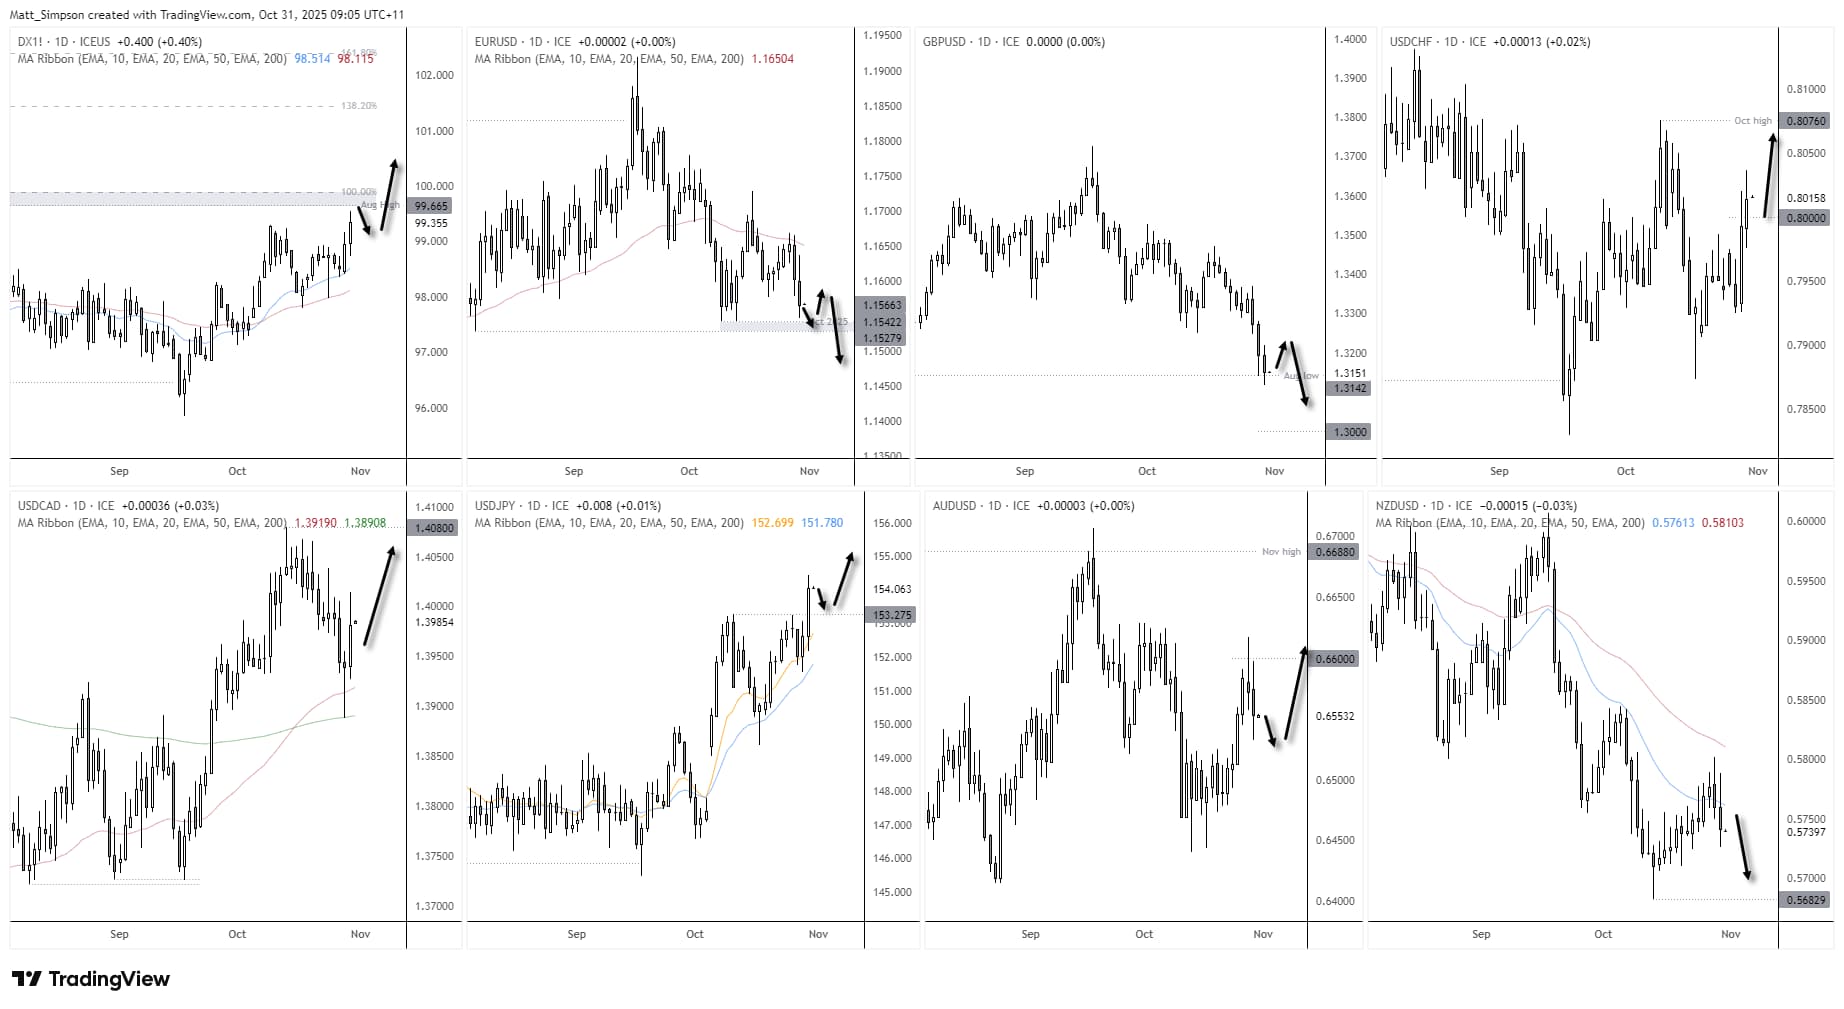
Chart analysis by Matt Simpson - source: TradingView
View the full economic calendar
-- Written by Matt Simpson
Follow Matt on Twitter @cLeverEdge
How to trade with City Index
You can trade with City Index by following these four easy steps:
- Open an account, or log in if you’re already a customer
• Open an account in the UK
• Open an account in Australia
• Open an account in Singapore
- Search for the market you want to trade in our award-winning platform
- Choose your position and size, and your stop and limit levels
- Place the trade