


US Dollar Strengthens Broadly as Kiwi and Yen Slide
The US dollar was the strongest major on Wednesday after the FOMC minutes revealed that “many” members viewed a December rate cut as “likely not appropriate.” Adding to the hawkish tone, the US Bureau of Labor Statistics cancelled the release of the October Nonfarm Payrolls report, with the next update delayed until 16 December — after the FOMC meeting. If the Fed was already against a cut before this development, the data blackout effectively eliminates any remaining hope of a December cut.
View related analysis:
- Gold Futures Look Set To Bounce From 4000, Though Headwinds Remain
- ASX 200 Market Wrap: Fresh 7-Month Low for CBA, FMG Weathers the Storm
- British Pound Outlook into UK CPI: GBP/USD, GBP/CAD, GBP/AUD
- Swiss Franc Extends Dominance Against US dollar As Risk-Off Hits Wall Street
NZD and JPY Lead the Declines as USD Strength Broadens
- The New Zealand dollar (NZD) was the weakest FX major, with NZD/USD dropping below 56c to a fresh seven-month low.
- The Japanese yen (JPY) was the second weakest, seeing USD/JPY rise nearly 1% to a 10-month high, trading within pips of the 157 handle.
- The Australian dollar (AUD) tracked the Kiwi, falling to a one-month low, with traders now eyeing a potential bearish break of the 200-day SMA.
- EUR/USD fell for a fourth straight session, with Wednesday’s -0.5% loss its most bearish day of the run.
- USD/CHF accelerated higher for a fourth day, with its 0.9% rally marking its strongest daily gain in four months.
- USD/CAD posted a bullish engulfing day, reclaiming the 1.40 handle.
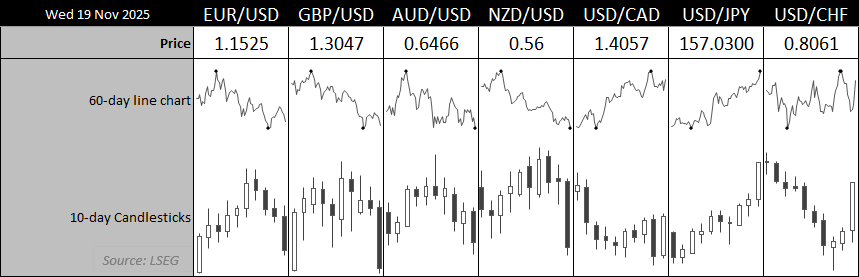
Chart analysis by Matt Simpson - data source: LSEG
US Dollar Index (DXY) Technical Analysis
USD Weekly Outlook – Wave C Extension Toward 101–102
Recent developments likely allows for a higher US collar over the coming weeks, which means the wave C I have been seeking to identify could be closer to 101 or even 102. The 200-week SMA sits at 10.52, the 50-week at 100.61 and the May high just below the 101 handle at 100.96.
These make potential resistance levels over the near term, but if the US dollar rally really gets its skates on then the 138.2% Fibonacci projection at 101.45, the 102 handle and 191.8% 102.4 also become areas of interest for bulls.
The US dollar index is on track for a bullish engulfing week. Also note that the RSI (14) is pointing higher without any signs of a bearish divergence and is nowhere near overbought.
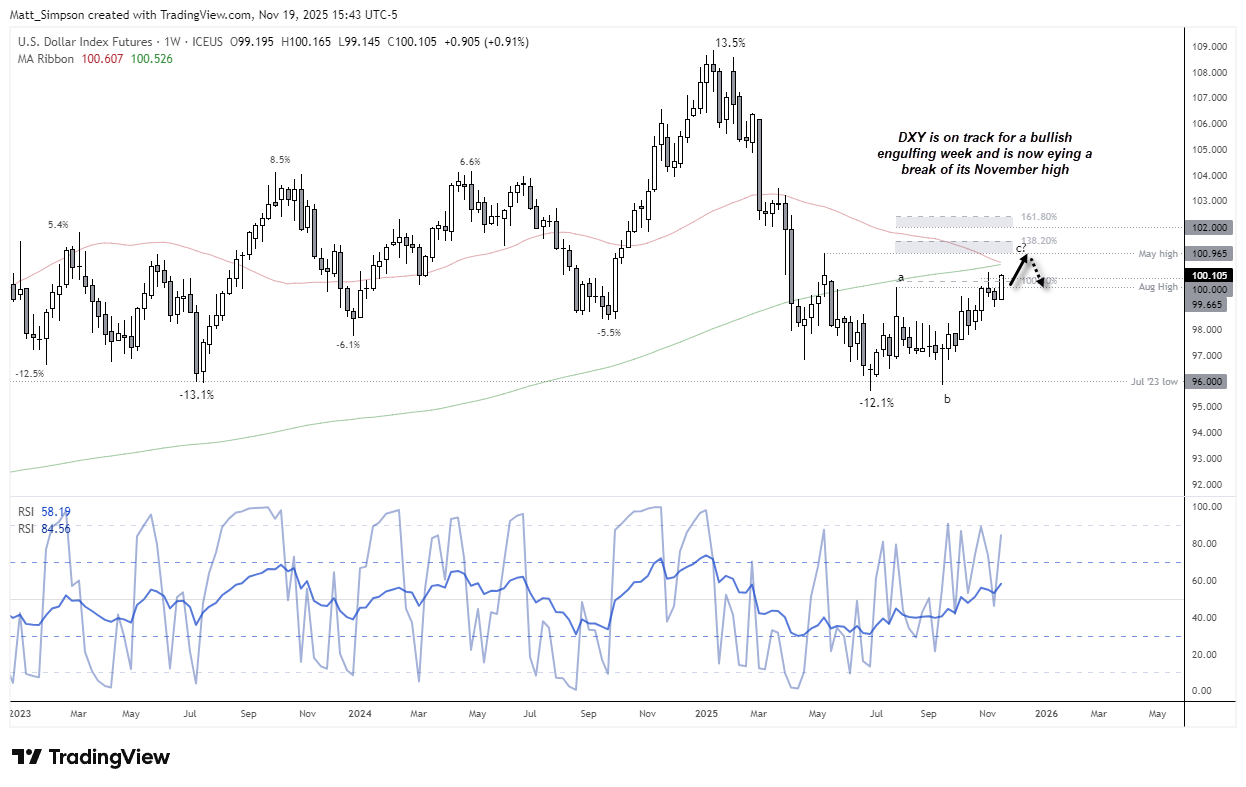
Chart analysis by Matt Simpson - data source: TradingView U.S. Dollar Index Futures

USD Daily Outlook – Breakout Watch Above 100.21
The USD Index is now eyeing a breakout above its November high (100.21). The daily chart shows a solid bullish trend, with Wednesday’s range-expansion candle pushing price cleanly away from both the 200- and 20-day EMAs. The 20-day EMA is also close to breaking back above the 200-day, and the broader trend remains constructive while price holds above the 50-day EMA.
One caveat: the US dollar typically underperforms in December based on seasonal patterns. Whether that translates into a meaningful pullback or simply takes some momentum out of the rally remains to be seen.

Chart analysis by Matt Simpson - data source: TradingView U.S. Dollar Index Futures

USD/JPY Technical Analysis: US Dollar vs Japanese Yen
Any concerns about a break above 155 now look redundant, with USD/JPY rising close to 1% and trading within pips of 157. Japan’s larger-than-expected fiscal package and fading expectations of BOJ intervention have allowed the yen to weaken, while the hawkish FOMC minutes added fuel to the USD/JPY rally.
The daily chart shows USD/JPY accelerating away from its 10-day EMA, with all EMAs fanning in a bullish sequence — a clear sign of trend strength. Both the RSI (14) and RSI (2) are overbought, but this is a macro-driven move, and RSI can stay pinned in the upper band for longer than usual during strong one-way flows.
Unless we hear verbal intervention from Japan’s Ministry of Finance, any dips are likely to be shallow and bought, with bulls eyeing a retest and potential break above the January high at 158.88.
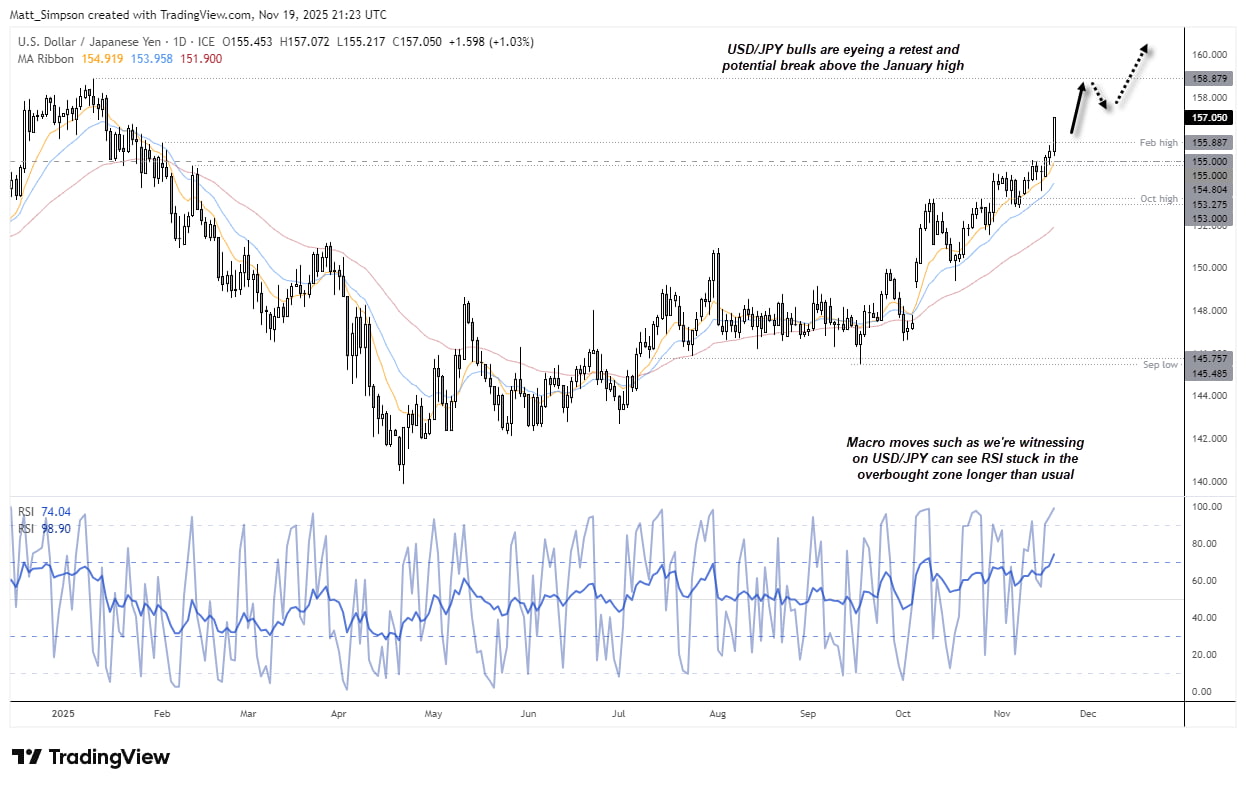
Chart analysis by Matt Simpson - data source: TradingView USD/JPY
View the full economic calendar
-- Written by Matt Simpson
Follow Matt on Twitter @cLeverEdge
How to trade with City Index
You can trade with City Index by following these four easy steps:
- Open an account, or log in if you’re already a customer
• Open an account in the UK
• Open an account in Australia
• Open an account in Singapore
- Search for the market you want to trade in our award-winning platform
- Choose your position and size, and your stop and limit levels
- Place the trade


