


The US dollar rallied to an 11-month high, supported by geopolitical tensions and shifting rate expectations. However, price action across major FX pairs is becoming less convincing, with several markets stalling at key levels. While GBP/USD is leading declines, others are holding near support—pointing to potentially mixed USD performance in the near term.
View related analysis:
- US Dollar Outlook: Bulls Resurface, Breakout on the Cards?
- FX Futures Positioning: US Dollar, EUR/USD, USD/JPY | COT report
- Australian Dollar Outlook: Geopolitics and US Data to Drive AUD/USD Volatility
- AUD/USD Outlook 2026: Key Drivers for the Australian Dollar in Q2
US Dollar Strength Builds As GBP/USD Breaks Lower While FX Signals Diverge
The US dollar index rose for a fifth consecutive session on Monday, breaking out to an 11-month high in line with last week’s bullish bias.
Geopolitical tensions remained elevated after Iran labelled Trump’s peace proposals “unrealistic”, while the US increased its military presence in the region and warned it could target Iran’s energy infrastructure.
Fed President Williams said interest rates are “well positioned” to respond to any supply shock stemming from the conflict. While that keeps the door open to policy in either direction, markets are increasingly pricing out rate cuts rather than seriously considering hikes at this stage.
The US dollar is likely to remain supported in the absence of clear de-escalation in the Middle East. However, there are early signs that performance could become more mixed, with several major FX pairs approaching key support and resistance levels.
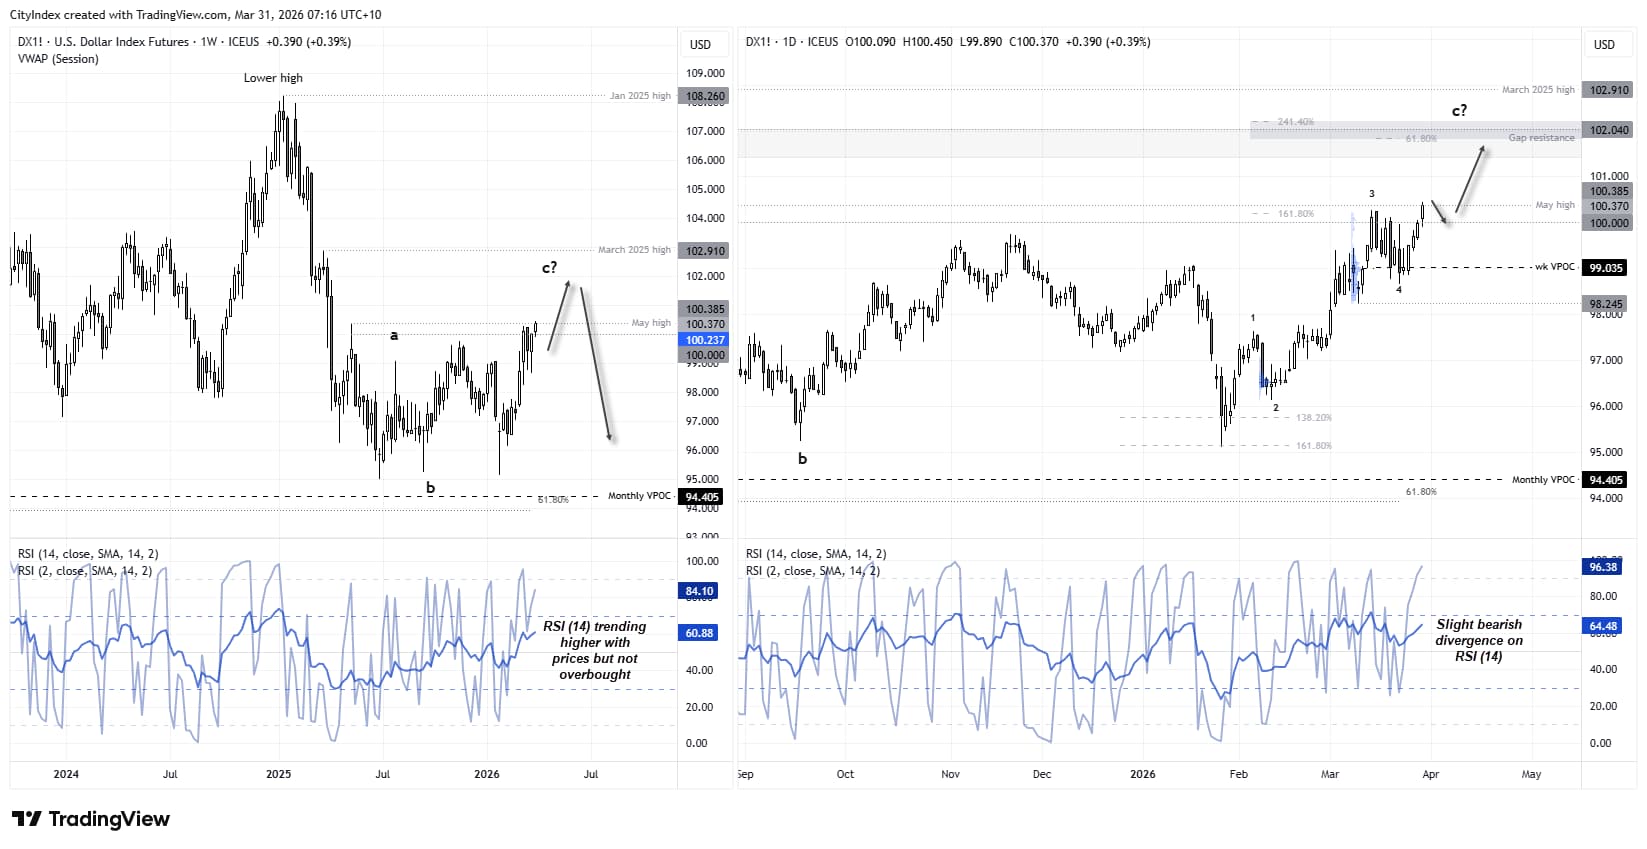
US Dollar Index (DXY) Technical Analysis
The daily chart on the right shows that I have labelled a five-wave move from the January low.
- The trend has featured timely and shallow pullbacks, with wave 3 landing around the 161.8% Fibonacci level.
- Wave 4 marked a false break of the 99 handle and a nearby high-volume node (HVN).
- A 61.8% projection sits just below gap resistance and the 102 handle, making it a viable target for bulls. It also sits just beneath the 241.4% Fibonacci projection.
- Given I suspect we are in wave 5, bulls may look to buy dips on the US dollar index or selectively fade rallies on other pairs where technicals allow.
The weekly chart suggests that a wave C could be forming. As these typically terminate with a five-wave rally, the current move may mark the end of the correction from the January 2025 high.
My broader bias has been for the US dollar to eventually break below 94 later this year and resume the larger bearish trend that began in 2022. However, a key risk to that outlook is a sustained escalation in the Middle East, which could easily invalidate the bearish case.
Source: ICE, TradingView
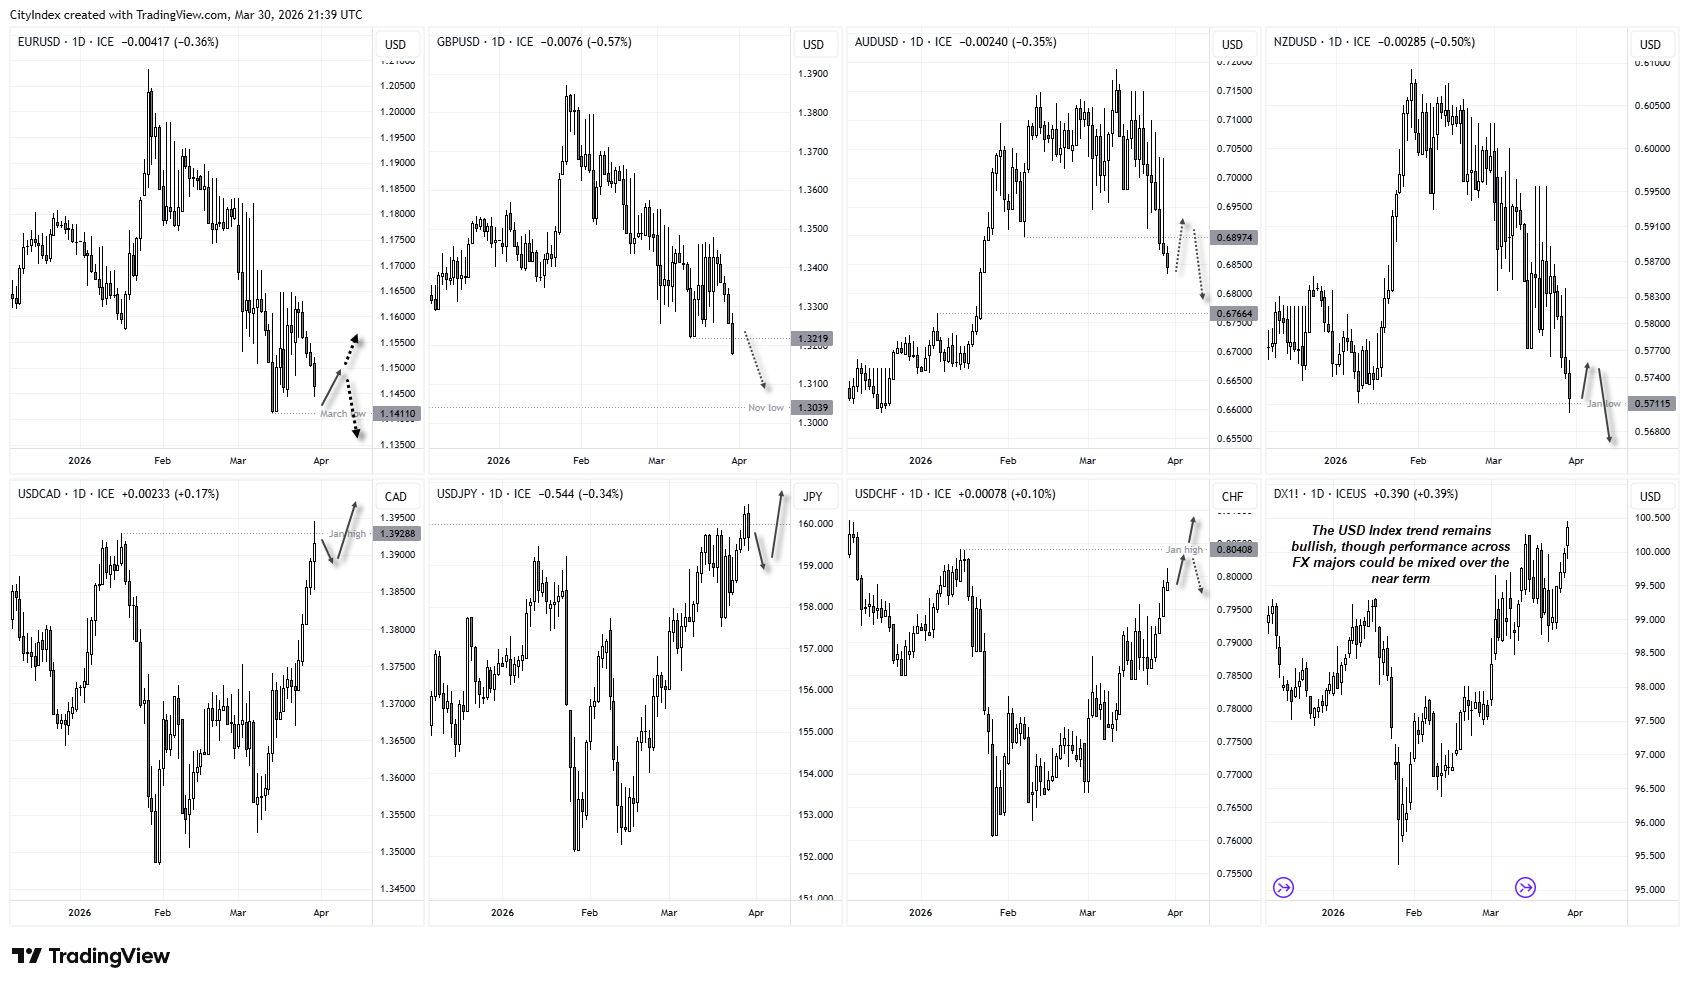
GBP/USD Leads Declines, USD Performance Could Be Mixed
US dollar strength remains intact, but price action across major FX pairs is becoming less convincing as several test key support and resistance levels. While GBP/USD is leading declines, others are showing signs of hesitation—pointing to potentially mixed USD performance in the near term.
EUR/USD holding above support
Perhaps the biggest near-term threat to US dollar bulls is that EUR/USD is holding above its March low. There is a reasonable chance the euro defends this level initially, which could prompt at least a minor pullback in the US dollar index. That still allows some upside wriggle room for the dollar, though bulls may want to tread carefully and remain nimble.
GBP/USD Breaks Support
The British pound was the weakest FX major on Monday, with GBP/USD falling to its lowest level since November and closing near the session low. Bears now appear to have 1.31 in their sights, with potential for a retest of the November low.
AUD/USD Edges Lower
The Australian dollar fell for a seventh consecutive day, although bearish momentum is clearly waning. Given the recent break from an 8-week range following an extended rally, I would have expected a sharper selloff. This suggests bears may need to be cautious at current levels and instead look for opportunities to fade rallies at higher prices.

NZD/USD Clings to Support
The New Zealand dollar has fallen -6.4% from its January high and still appears biased lower. However, price is clinging to the January low for support. A minor bounce could be on the cards, meaning bears may want to reassess shorts at higher levels or wait for a confirmed bearish breakout.
USD/CAD Probes January High
USD/CAD rose for a fifth day despite firmer crude oil prices, reaching its January high. However, like NZD/USD, it has yet to break decisively higher. While momentum favours an eventual breakout, the pair may first pause or see a minor pullback.
USD/JPY Falters Around 160
Traders appear to have drawn a soft ceiling around 160, with moves above that level fuelling intervention fears from Japan’s Ministry of Finance (MOF). While that risk remains, authorities are more concerned with the pace of yen depreciation than the level itself.
USD/JPY formed a bearish outside day and closed back below 160, reinforcing the idea that several USD pairs are stalling near key levels. This muddies the near-term outlook for US dollar bulls.
USD/CHF Bulls Eye January High
The Swiss franc is one of the few FX majors still allowing for an extended USD rally, similar to GBP/USD’s downside move. Bullish momentum on USD/CHF remains firm, and with the SNB favouring a weaker franc and openly discussing intervention, long USD/CHF appears more attractive than short. The January high is the next key resistance level and sits within a typical 1–2 day range.
Source: ICE, TradingView
View the full economic calendar
-- Written by Matt Simpson
Follow Matt on Twitter @cLeverEdge
How to trade with City Index
You can trade with City Index by following these four easy steps:
- Open an account, or log in if you’re already a customer
• Open an account in the UK
• Open an account in Australia
• Open an account in Singapore
- Search for the market you want to trade in our award-winning platform
- Choose your position and size, and your stop and limit levels
- Place the trade


