


This week’s Commitment of Traders (COT) report reveals shifting sentiment across major futures markets. Asset managers increased net-shorts on the US dollar ahead of Jerome Powell’s Jackson Hole speech, while Japanese yen positioning showed signs of recovery after weeks of weakness. Meanwhile, net-long exposure to VIX futures surged to its highest level since 2022, signalling traders are bracing for volatility as we move into September.
View related analysis:
- Australian Dollar Outlook: Dip Buyers to Circle The Aussie
- Japanese Yen Outlook: BOJ Hike Talk Builds as USD/JPY Eyes 149
- Gold, Silver, Crude Oil Outlook: Technical Analysis, Market Positioning
Charts prepared by Matt Simpson - data source: CME, LSEG
Weekly COT Report Highlights: US Dollar Shorts Deepen, Yen Recovers, VIX Net-Longs Surge
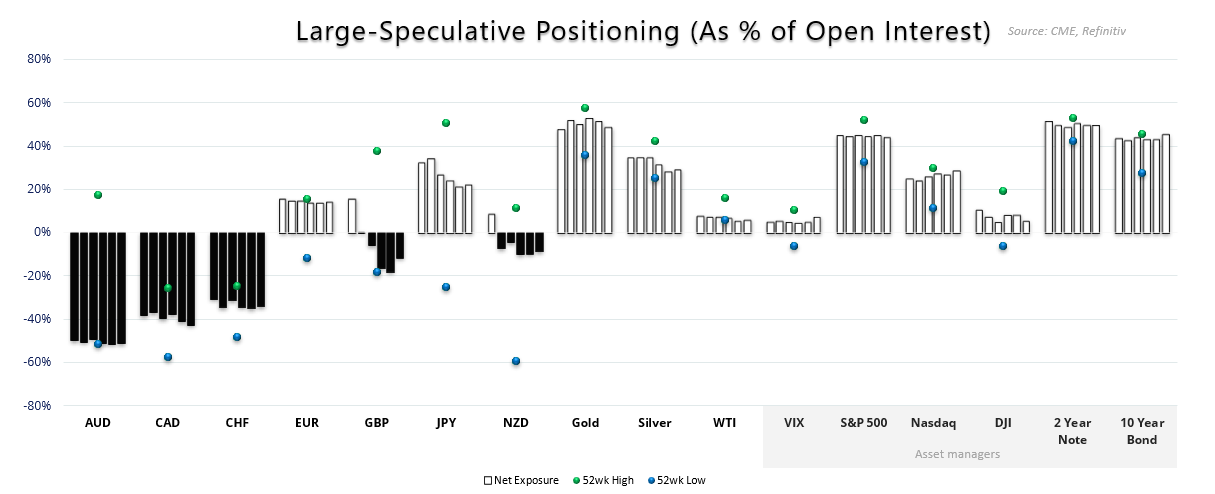
- US Dollar (USD): Asset managers increased net-short exposure by 3k contracts ahead of Jerome Powell’s Jackson Hole speech
- European dollar (EUR): Large speculators increased net-long exposure by 3.3k contracts
- British pound (GBP): Net-short exposure fell -13.9k contracts to -25.2k
- Japanese yen (JPY): They increased gross-longs to the yen for the first week in four
- Australian dollar (AUD): Traders increased gross-short exposure by 6.9k contracts to 94.9k
- Canadian dollar (CAD): Net-short exposure increased by 3k contracts
- Swiss franc (CHF): Effectively flat on the week, net-short at 27.2k contracts
- Volatility Index Positioning (VIX): Net-long exposure rose to a near 3-year high
- Gold (GC): An increase of short bets pulled net-long exposure to gold lower by -12.8k contracts
- Crude Oil (WTI): Net-long exposure rose 3.5k contracts to 120.2k
- S&P 500 (ES): Asset managers reduced net-long exposure by -15.8k contracts
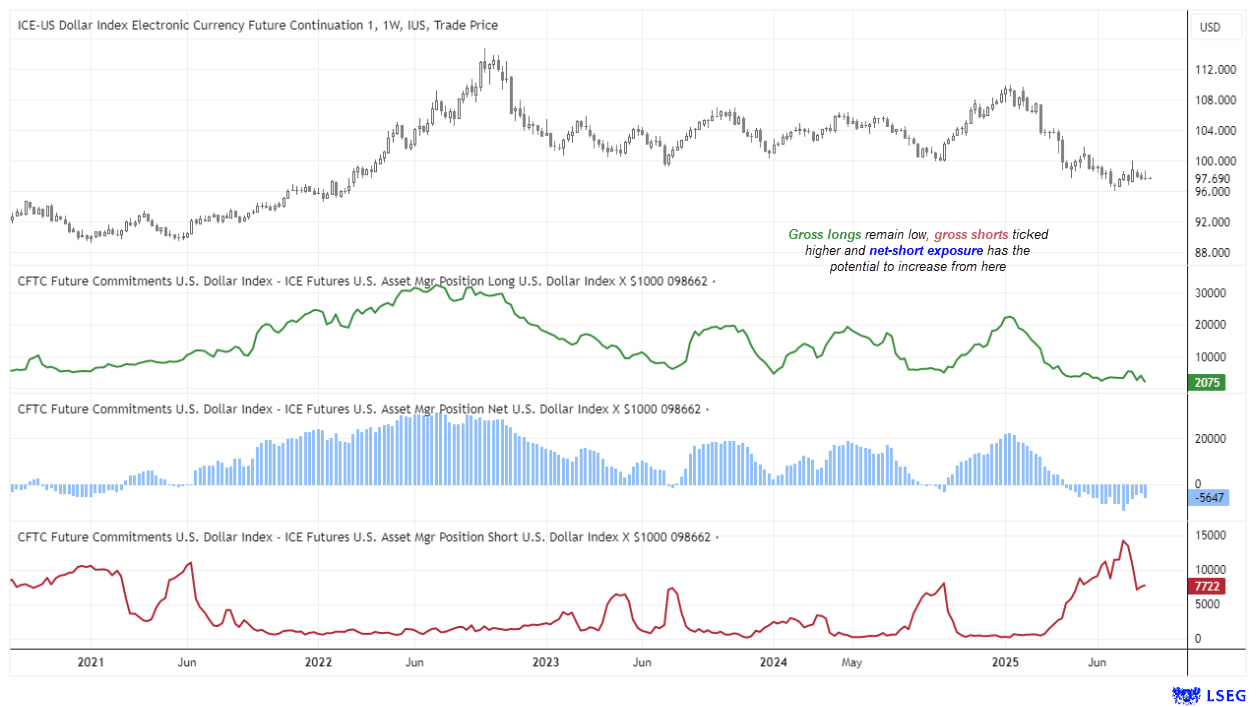
US Dollar Positioning (IMM Data): Weekly COT Report Analysis
Asset managers are rarely short USD futures, though they have been since Mid April. And while the 11.k contracts of net-short exposure may not sound a lot, it was its record high reached five weeks ago. The 2000 increase of net-short exposure could therefore be deemed as significant, especially since this was before Jerome Powell delivered a speech that was slightly more dovish than expected.
Asset managers have a very low gross-long exposure of 2075 contracts and gross shorts only ticked higher by 187 contracts last week, to 7722. Though we could find that gross-shorts rose considerably more in the next report, and as they do not appear to be at a sentiment extreme is suggests further downside for the US dollar.
![]() Chart prepared by Matt Simpson - data source: CME, LSEG
Chart prepared by Matt Simpson - data source: CME, LSEG
JPY/USD Positioning: Japanese Yen Futures – Weekly COT Report
Net-long exposure for the Japanese yen has been in a downtrend since April, though there’s reason to believe bulls may be returning to the table.
Large speculators increased their net-log exposure to the yen for the first week in three, and asset managers increased their by their fastest weekly pace in 18.
And with murmurs of Bank of Japan (BOJ) hikes resurfacing while the Federal Reserve (Fed) veer towards cuts, perhaps it is time for the Japanese yen to regain traction against the US dollar and send USD/JPY lower.
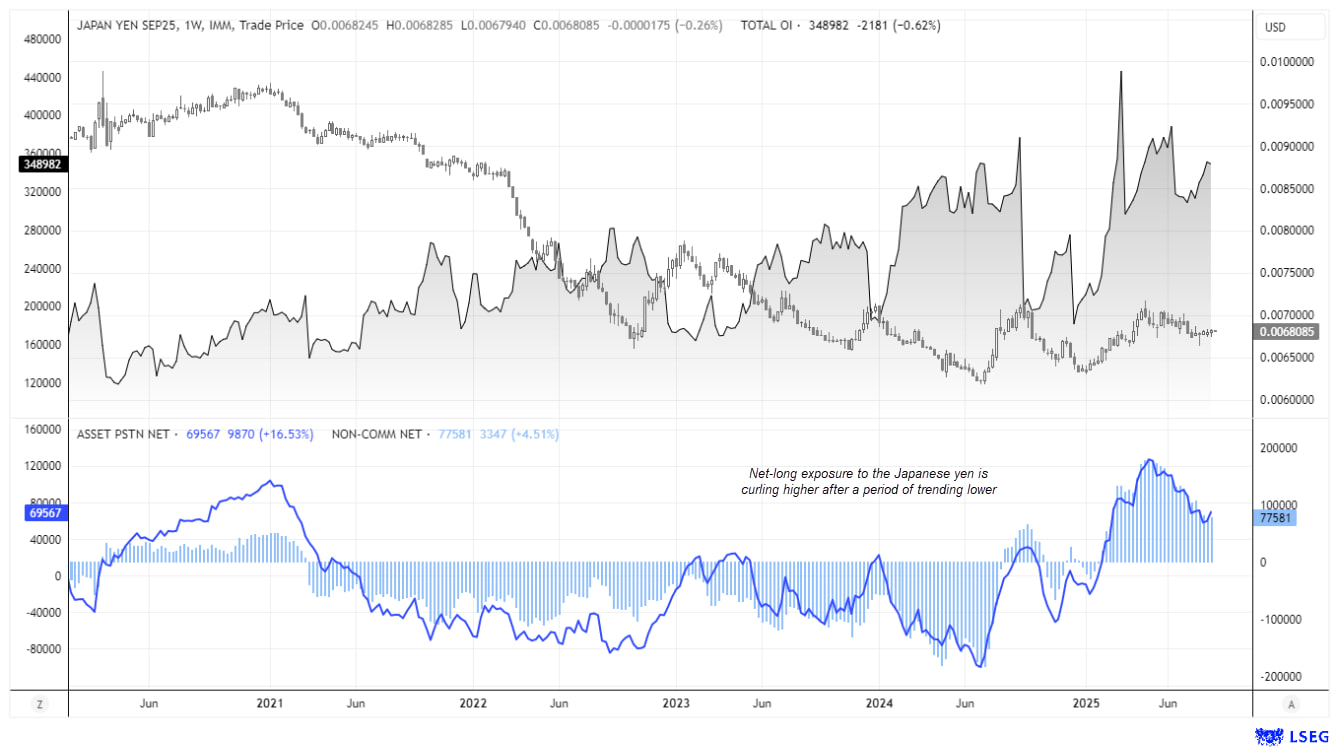
Chart prepared by Matt Simpson - data source: CME, LSEG
Volatility Index Positioning (VIX): Weekly COT Report Analysis
Traders appear to be anticipating heightened volatility as we head into September, with asset managers pushing their net-log exposure to VIX futures to their most bullish level since October 2022.
Moreover, this heighted level of net bullish exposure has been fuelled by a 7% increase in gross-longs to VIX (+6.2k contracts) alongside a -8.7% fall in gross shorts (-5.5k contracts).
Note the bullish outside week on the VIX futures chart which could also point towards a potential swing low for volatility.
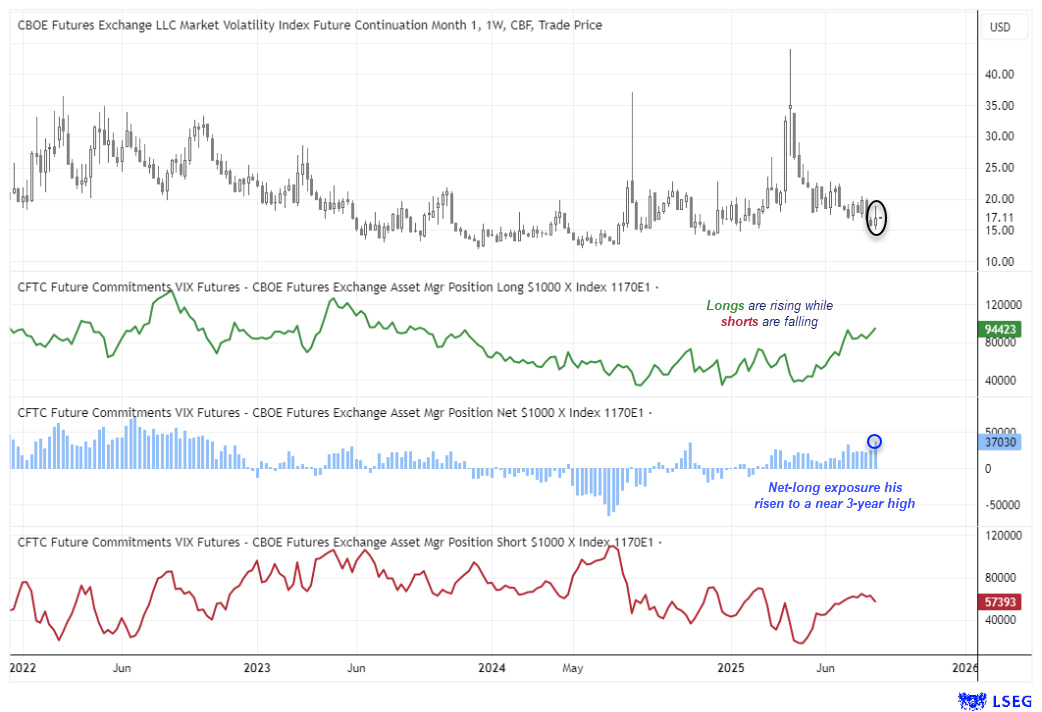
Chart analysis by Matt Simpson, Source: CME Futures, LSEG
View the full economic calendar
-- Written by Matt Simpson
Follow Matt on Twitter @cLeverEdge
How to trade with City Index
You can trade with City Index by following these four easy steps:
- Open an account, or log in if you’re already a customer
• Open an account in the UK
• Open an account in Australia
• Open an account in Singapore
- Search for the market you want to trade in our award-winning platform
- Choose your position and size, and your stop and limit levels
- Place the trade


