


This week’s Commitment of Traders (COT) report revealed sharp shifts in positioning across the US dollar, Japanese yen, and New Zealand dollar. Asset managers and large speculators were caught off guard by central bank surprises, with the Fed proving less dovish, the BOJ announcing ETF sales, and weak GDP data fuelling RBNZ cut expectations. These moves highlight the risks of trading ahead of major policy events, as positioning frequently failed to anticipate the actual outcome.
View related analysis:
- Australian Dollar Outlook: AUD/USD Under Pressure Ahead of CPI and PMIs
- USD/JPY, AUD/USD, Gold Analysis: COT report
- Japanese Yen Rebound, USD Weakness, Commodity FX Diverge: COT Report
- GBP/USD, EUR/GBP: COT Data Appears Favourable to British Pound Bulls
Weekly COT Report Highlights:
- US Dollar (USD): Traders increased their net-short exposure to the USD by $0.6 billion to -$9 billion last week
- European dollar (EUR): Large speculators reduced their net-long exposure to euro futures by -7.9k contracts
- British pound (GBP): Large speculators reduced net-short exposure to a mere -6.5k contracts, though bearish price action into Friday’s close suggests they will remain net-short in the next report
- Japanese yen (JPY): Net-long exposure fell to a 30-week low
- Australian dollar (AUD): Net-short exposure fell to an 18-week low
- Canadian dollar (CAD): Large specs and asset managers increased gross-longs by a combined 6.4k contracts and reduced shorts by -2.7k contracts
- Swiss franc (CHF): Asset managers reduced net-short exposure by -6.9kl contracts, their fastest weekly pace in 24
- New Zealand dollar (NZD): Net-short exposure roughly doubled to -18k contracts amid rising expectations of RBNZ cuts
- Gold (GC): Large speculators increased net-long exposure to a 31-week high
- Crude Oil (WTI): Net-long exposure increased for the first week in four, rising 16.8k contracts with gross longs down -6.7% and longs up 1.5%
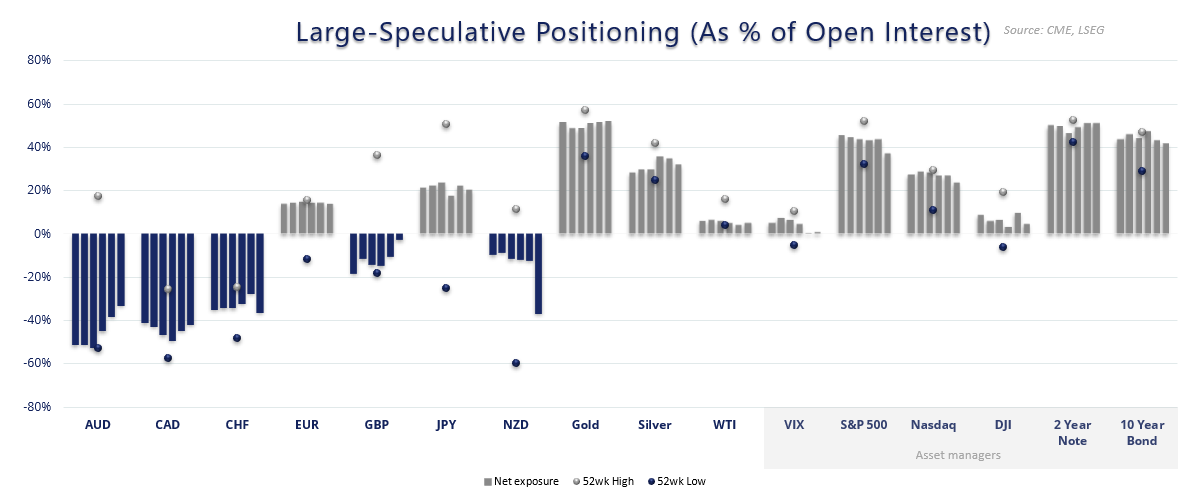
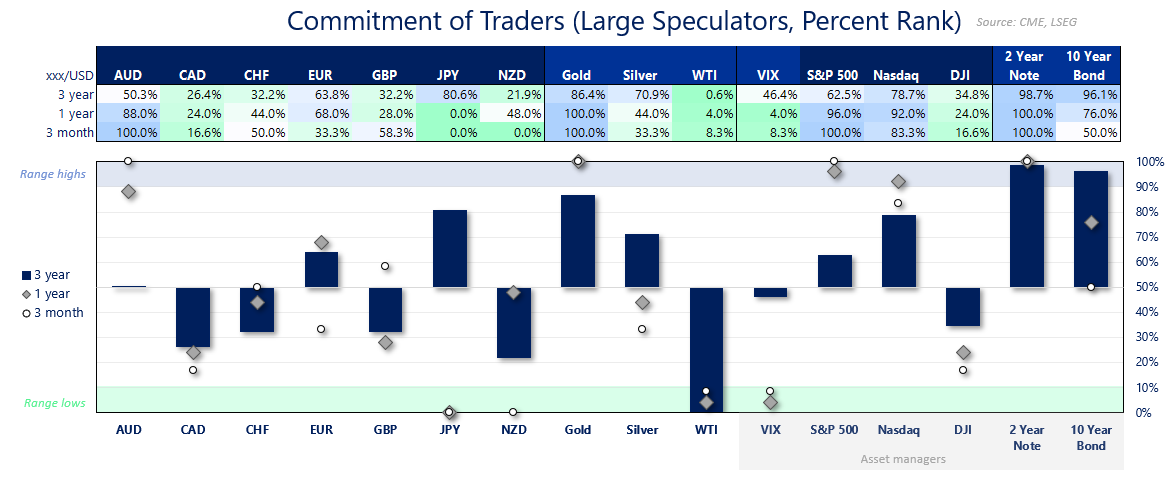
Chart analysis by Matt Simpson, Source: CME, IMM, LSEG
COT Report Analysis: US Dollar, Japanese Yen, New Zealand Dollar
There are several recent examples where market positioning failed to anticipate the actual move. Asset managers more than doubled their net-short exposure to the US Dollar Index (DXY) ahead of the FOMC meeting, only to see earlier USD losses mostly erased by the week’s close. Traders also shied away from net-long bets on the Japanese yen before the Bank of Japan (BOJ) meeting, yet the yen strengthened after the BOJ announced it would begin scaling back ETF purchases.
Similarly, large speculators in the British pound were close to flipping net-long, but GBP/USD futures instead printed a bearish outside day as the US dollar rebounded post-Fed. A notable bearish pinbar also appeared on the weekly EUR/USD chart, despite reduced gross-longs and an increase in gross-shorts by Tuesday’s close.

US Dollar Index (DXY) Positioning: Fed Resilience Fuels USD Rebound
The US dollar staged a strong rebound last week after the Federal Reserve proved less dovish than markets had anticipated. This saw the DXY print a bullish weekly pinbar candle into Friday’s close, highlighting the resilience of USD demand.
Large speculators were wrongfooted, having entered the week with rising net-short exposure to the US dollar. Importantly, the increase in net-short positioning came largely from long liquidation rather than an aggressive build-up of short bets. This dynamic suggests that much of the USD rebound was fuelled by fresh bullish positioning rather than simple short covering.
Among asset managers, net-short exposure to the US dollar was broadly flat. However, if USD momentum extends, the next Commitment of Traders (COT) report could reveal a meaningful increase in long positions from this group as well.
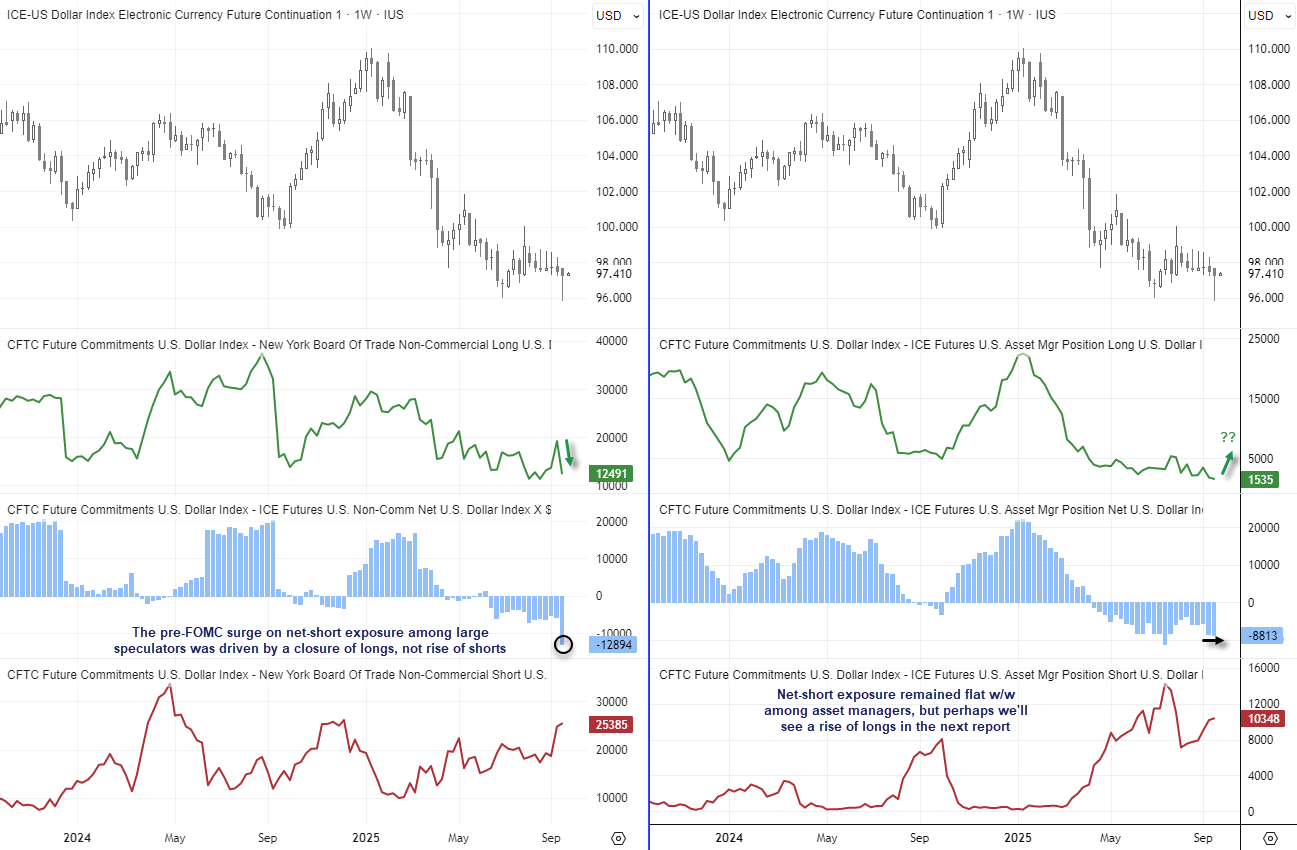
Chart analysis by Matt Simpson, Source: CME, IMM, LSEG

Japanese Yen Futures: BOJ ETF Unwind Catches Traders Off Guard
Traders appeared confident that the Bank of Japan (BOJ) would deliver another uneventful policy decision, with net-long exposure in Japanese yen futures falling to a six-month low ahead of the meeting. While the BOJ held rates as expected, markets were caught off guard by the announcement that it will begin unwinding ETF and REIT purchases.
This surprise shift potentially sets the stage for further yen strength into November — a move some former BOJ officials had flagged as likely. As a result, those who exited long positions ahead of the meeting may be forced to reconsider, given the scope for a more hawkish policy path.
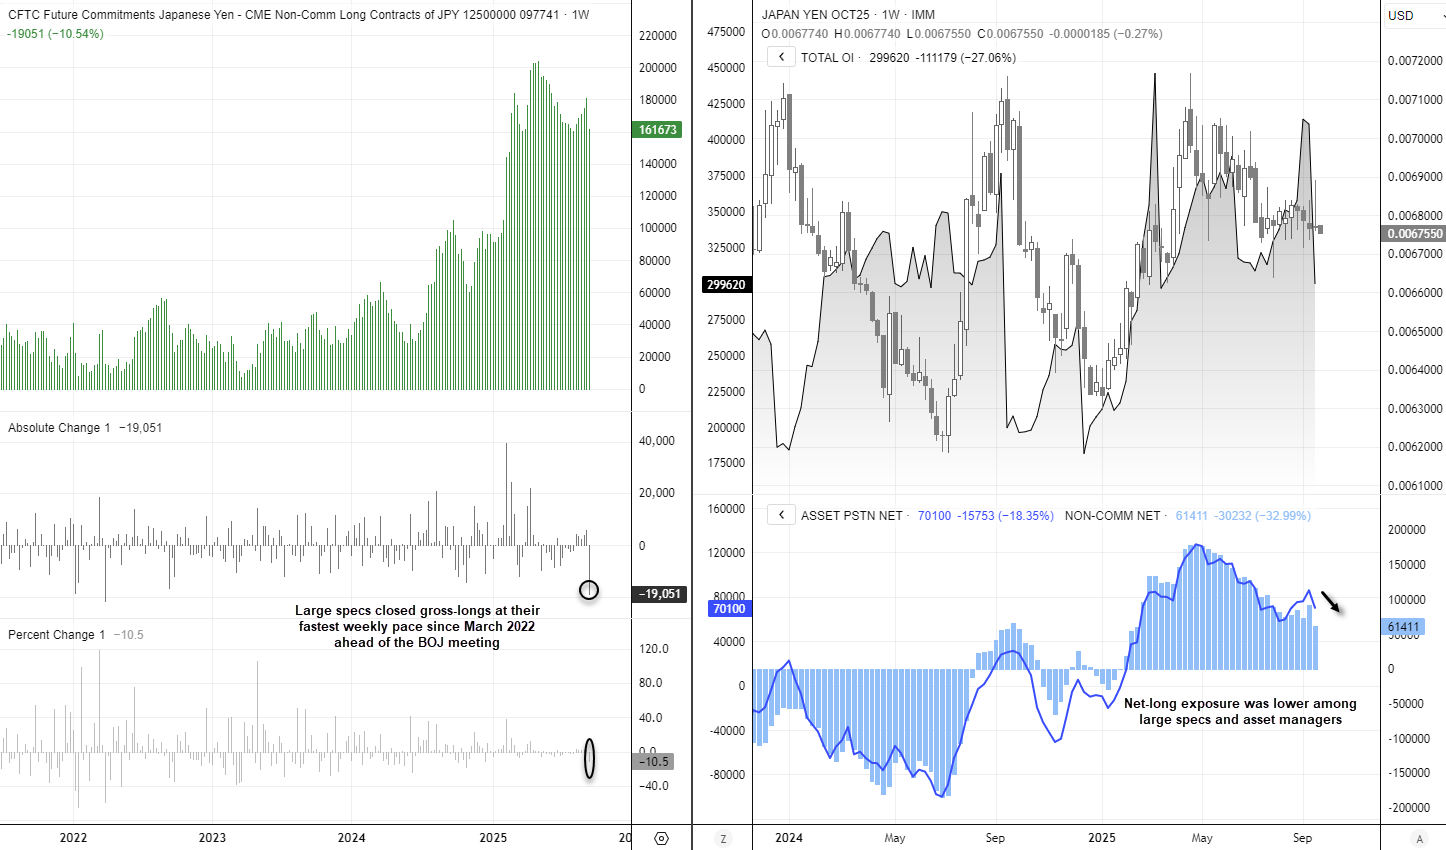
Chart analysis by Matt Simpson, Source: CME, IMM, LSEG
New Zealand Dollar Futures: RBNZ Cut Bets Drive Bearish NZD Positioning
Large speculators and asset managers turned their most bearish in 14 weeks as odds of further Reserve Bank of New Zealand (RBNZ) rate cuts increased. A bearish outside week formed on the NZD/USD futures chart, suggesting a swing high may now be in place just above 0.60.
Traders who reduced exposure ahead of last week’s weak New Zealand GDP report were vindicated. Large speculators closed -6.2k long contracts (-40%) by Tuesday’s close — their fastest pace of long liquidation since mid-December. Meanwhile, gross-shorts rose by 3k contracts (+12.5%), reaching a three-month high.

Chart analysis by Matt Simpson, Source: CME, IMM, LSEG
View the full economic calendar
-- Written by Matt Simpson
Follow Matt on Twitter @cLeverEdge
How to trade with City Index
You can trade with City Index by following these four easy steps:
- Open an account, or log in if you’re already a customer
• Open an account in the UK
• Open an account in Australia
• Open an account in Singapore
- Search for the market you want to trade in our award-winning platform
- Choose your position and size, and your stop and limit levels
- Place the trade


