


The US dollar was the strongest major currency on Wednesday after hawkish FOMC minutes revived rate hike speculation. Several officials warned that further tightening may be required if inflation remains elevated, prompting a reassessment of the Fed’s policy path.
View related analysis:
- Japanese Yen Price Action Setups Across USD/JPY, GBP/JPY, EUR/JPY, CAD/JPY
- FX Futures Positioning: USD, EUR, GBP, CAD | COT report
- Gold Price Outlook: Options Sentiment Extreme as Bears Target 4800
- Crude Oil Outlook: WTI Tests $62 Support as COT Signals Limited Pullbacks
- GBP/AUD Slumps to 13-Year Low as RBA–BoE Divergence Widens
US Dollar Strengthens After Hawkish FOMC Minutes, USD/JPY Extends Rally
- US bond yields rose for a second day, sending the 2-year to 3.47% and the 10% up to 4.087%.
- Wall Street pared earlier gains, which had seen the S&P 500 and Nasdaq rise over 1% before the minutes before pulling back from their daily highs
- EUR/USD fell to am 8-day low on Wednesday on the dual combination of hawkish FOMC minutes and news that ECB chief Christine Lagarde will step down before her term ends.
- USD/JPY rose close to 1% to a six-day high as the Japanese yen was the second weakest FX major on Wednesday
- NZD/USD formed a prominent bearish engulfing candle and fell -1.3% during its worst day in five months, after the RBNZ held rates and stifled speculation of a rate hike any time soon
- AUD/USD closed back below 0.71 ahead of today’s employment report and shows the potential to head for 70c, with price action dropping clues of a choppy retracement for its cycle highs
- Commodities alongside geopolitical tensions involving Iran, with gold recouping most of Tuesday’s losses and silver rising over 5%
- WTI crude oil posted a solid rally from the key support level around $62
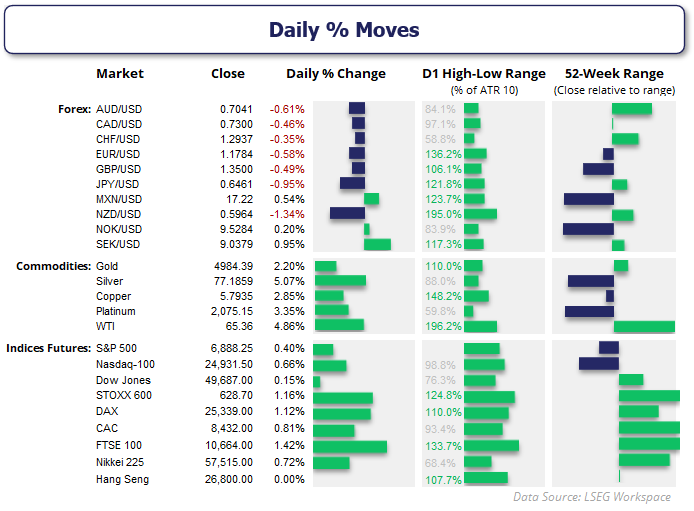
Source: LSEG Workspace.

US Dollar Index (DXY) Technical Analysis
While I maintain my core bias of a weaker US dollar as the year progresses, risks are skewed to the upside for USD over the near term. The weekly chart shows a bullish candle formed two weeks ago, marking a false break beneath the 96 handle and the June and September lows.
The daily chart shows momentum has accelerated to the upside for the dollar, though it is fast approaching a cluster of resistance around 97.77–98.00. This zone includes prior swing highs and lows alongside the 20- and 50-day moving averages. It could prove pivotal for the US dollar in the near term, as a break above it would likely signal deeper pullbacks for its FX major peers. And with the Fed now reintroducing a hike narrative into the mix, traders may be more sensitive to hot data than they previously were.
US data of interest for forex traders includes jobless claims, the Philly Fed manufacturing index, advance Q4 GDP, consumer sentiment and flash PMI.
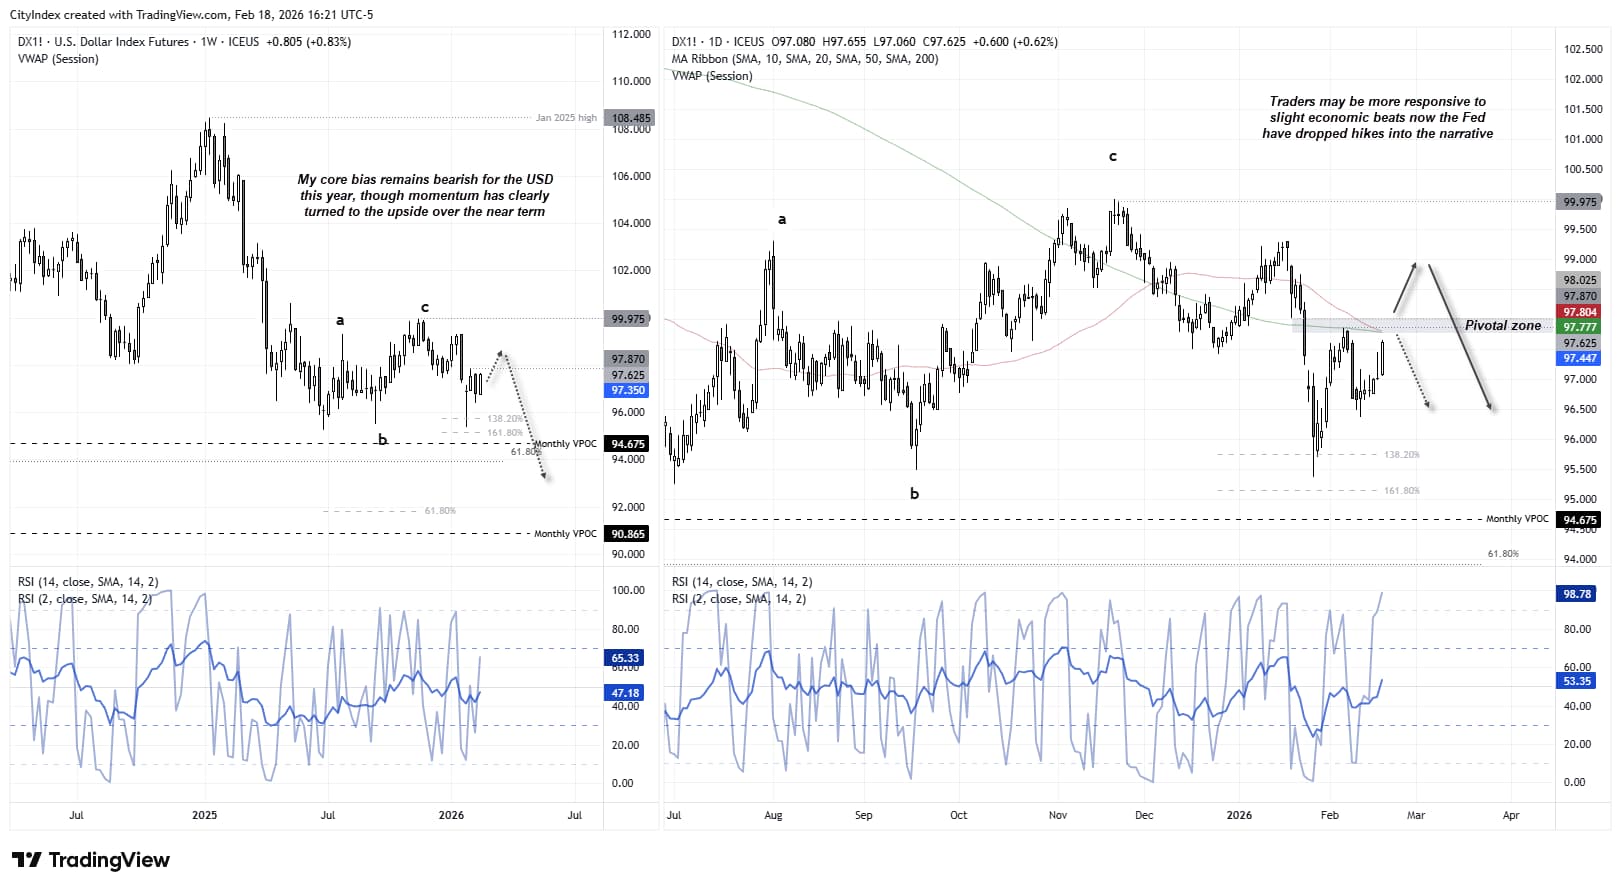
Source: ICE, TradingView
US Dollar Futures Positioning Signals Potential Sentiment Extreme
Given the recent pickup in bullish price momentum, it is worth assessing whether a sentiment extreme is forming in the US dollar futures market.
Last week, futures traders were net-short the USD by $20.5 billion — their most bearish level since June and near levels that have coincided with bullish reversals since mid-2023.
Large speculators were also on the cusp of flipping to net-long exposure in US Dollar Index futures. Asset managers increased their exposure as well, albeit only marginally, and may soon follow large specs should US data continue to improve. This would mark a shift from the broader pattern of recent years, where asset managers have tended to call the dollar’s direction more accurately than large speculators.
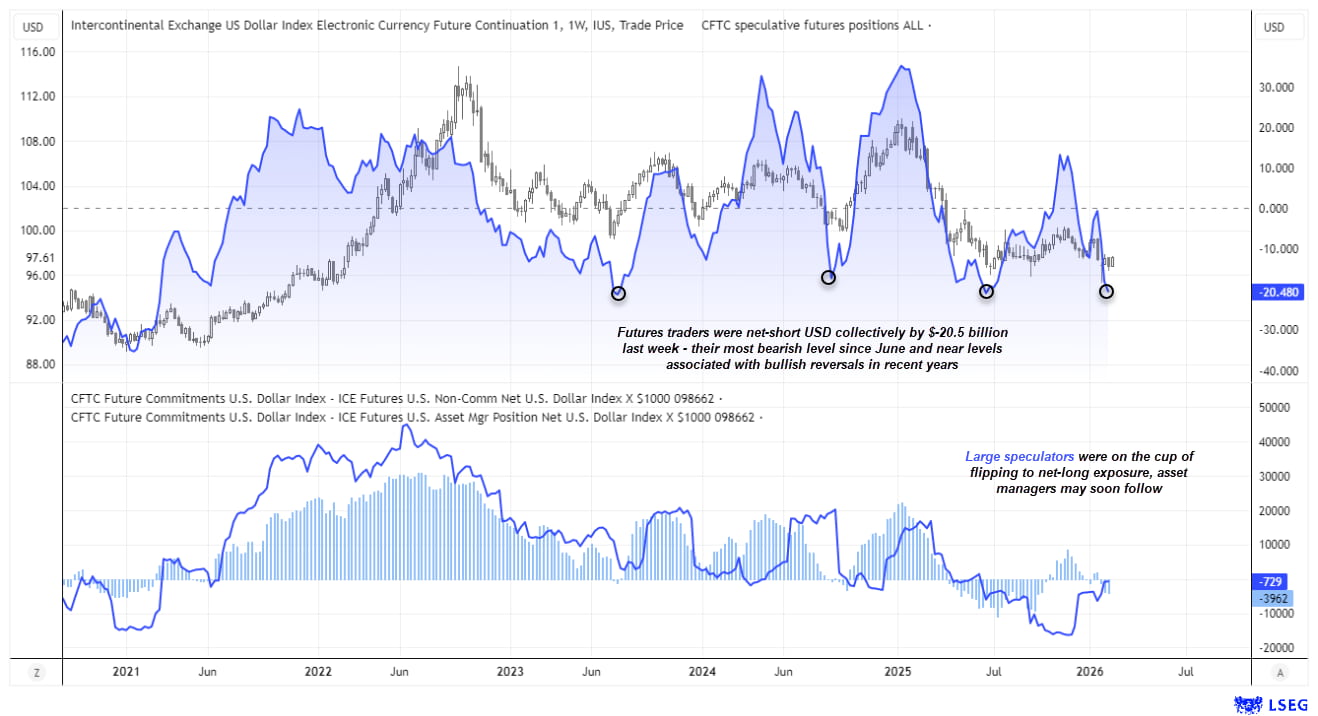
Source: CFTC (COT), ICE, LSEG

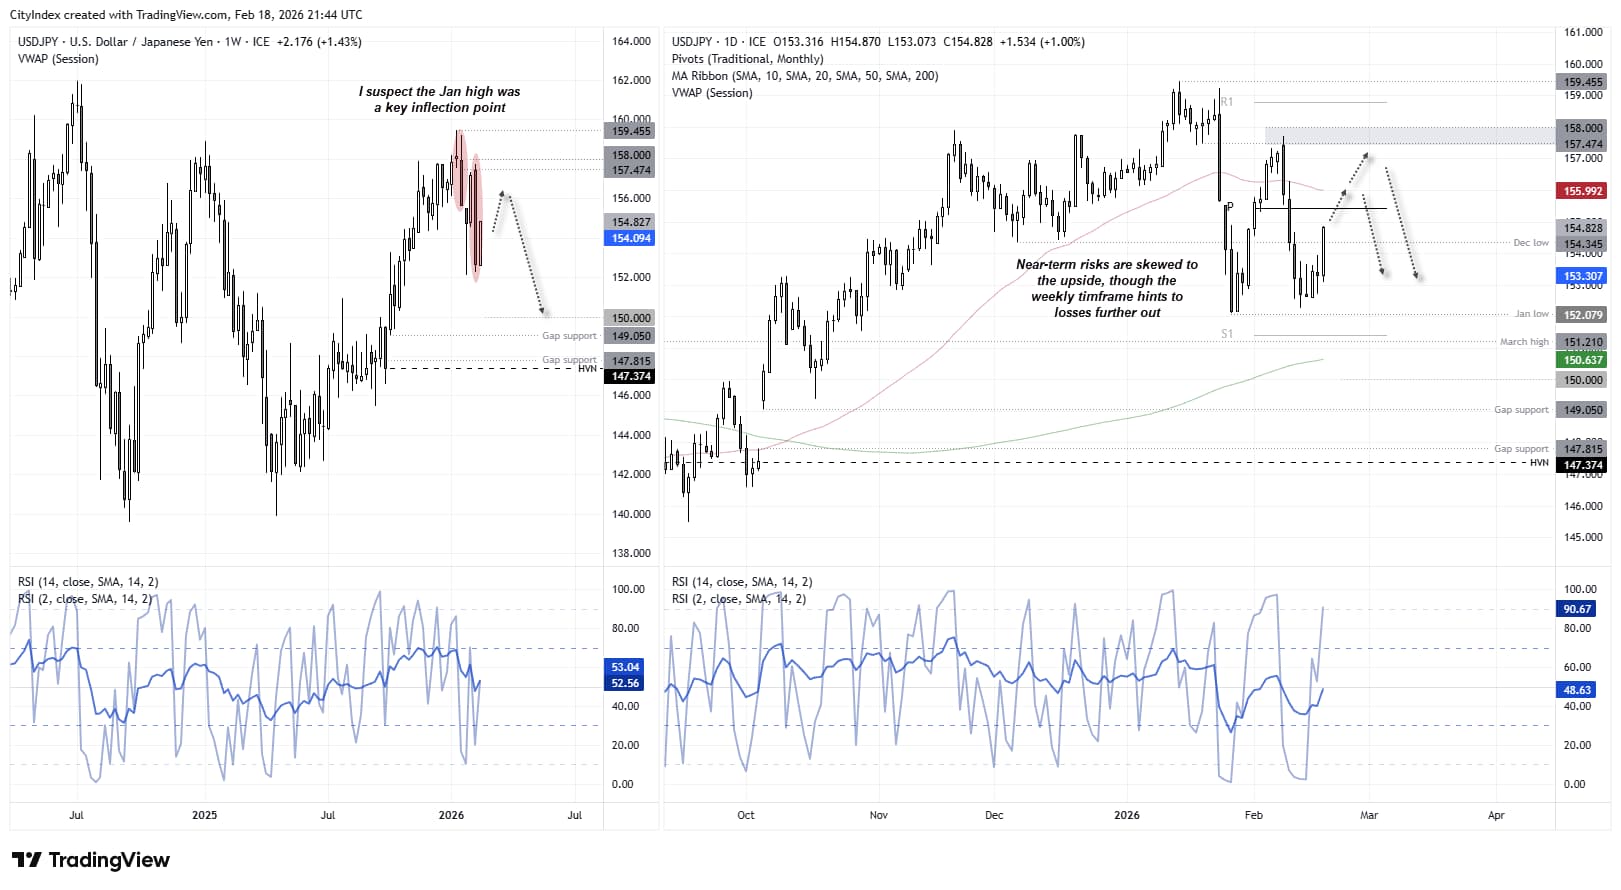
USD/JPY Technical Analysis: US Dollar vs Japanese Yen
Bullish momentum has supported my near-term outlook for USD/JPY, with the pair closing above the December high and approaching my target near the monthly pivot point at 155.43. As with the US Dollar Index (DXY), a pivotal resistance zone looms overhead, with the 50-day moving average converging near the 156.00 handle.
While near-term risks appear skewed to the upside for USD/JPY, I maintain my broader bias that a significant high formed at 159.45 in January and that the Japanese yen may regain strength over time. The current rebound on the daily chart is effectively retracing part of last week’s bearish engulfing candle.
From here, I am seeking evidence of a swing high to align momentum with the January sell-off and potentially pave the way for a move back towards 150.00.
Source: CFTC (COT), ICE, LSEG
View the full economic calendar
-- Written by Matt Simpson
Follow Matt on Twitter @cLeverEdge
How to trade with City Index
You can trade with City Index by following these four easy steps:
- Open an account, or log in if you’re already a customer
• Open an account in the UK
• Open an account in Australia
• Open an account in Singapore
- Search for the market you want to trade in our award-winning platform
- Choose your position and size, and your stop and limit levels
- Place the trade


