


The US dollar was the strongest major currency on Wednesday following the latest FOMC meeting. While the Fed delivered the expected 25bp rate cut and one member voted for a 50bp move, the dollar rallied during Jerome Powell’s press conference when he said that “a further reduction in the policy rate at our December meeting is not a foregone conclusion — far from it.” Given that Fed funds futures had priced in a roughly 90% probability of another cut in December, the comment surprised traders positioned for a dovish outcome, sending the US yield curve — and the dollar — higher.
View related analysis:
- Yen Strength Leads FX Ahead of BOJ, Fed: USD/JPY, AUD/JPY, AUD/USD
- USD/JPY Hits Resistance, Implied Volatility Subdued Ahead of Fed, BOJ
- ASX 200 Morning Market Outlook: Westpac (WBC) Leads Big 4 Lower Post-CPI
- Bitcoin Bounce Fails to Shake Bearish Outlook
Major Forex Moves: USD Leads, AUD and NZD Falter
- The US dollar index rose 0.4% from its 20-day EMA — its best day in 14 sessions — and probed the 99 handle.
- EUR/USD fell 0.4% to close at a two-week low of 1.16 after meeting resistance at its 50-day EMA
- The Swiss franc was the weakest major, with USD/CHF rising 0.69% and briefly trading back above 0.80.
- The British pound was the second-weakest, with GBP/USD falling 0.63% and testing its August low.
- USD/CAD recouped most of its earlier losses to close effectively flat, forming a bullish pinbar at its 200-day EMA
- USD/JPY formed a bullish outside day and now trades less than one average daily range away from its October double-top high.
- AUD/USD snapped a five-day winning streak despite hot CPI figures, forming a shooting-star candle around 0.66.
- NZD/USD formed a bearish engulfing candle, hinting at a swing high around 0.58.
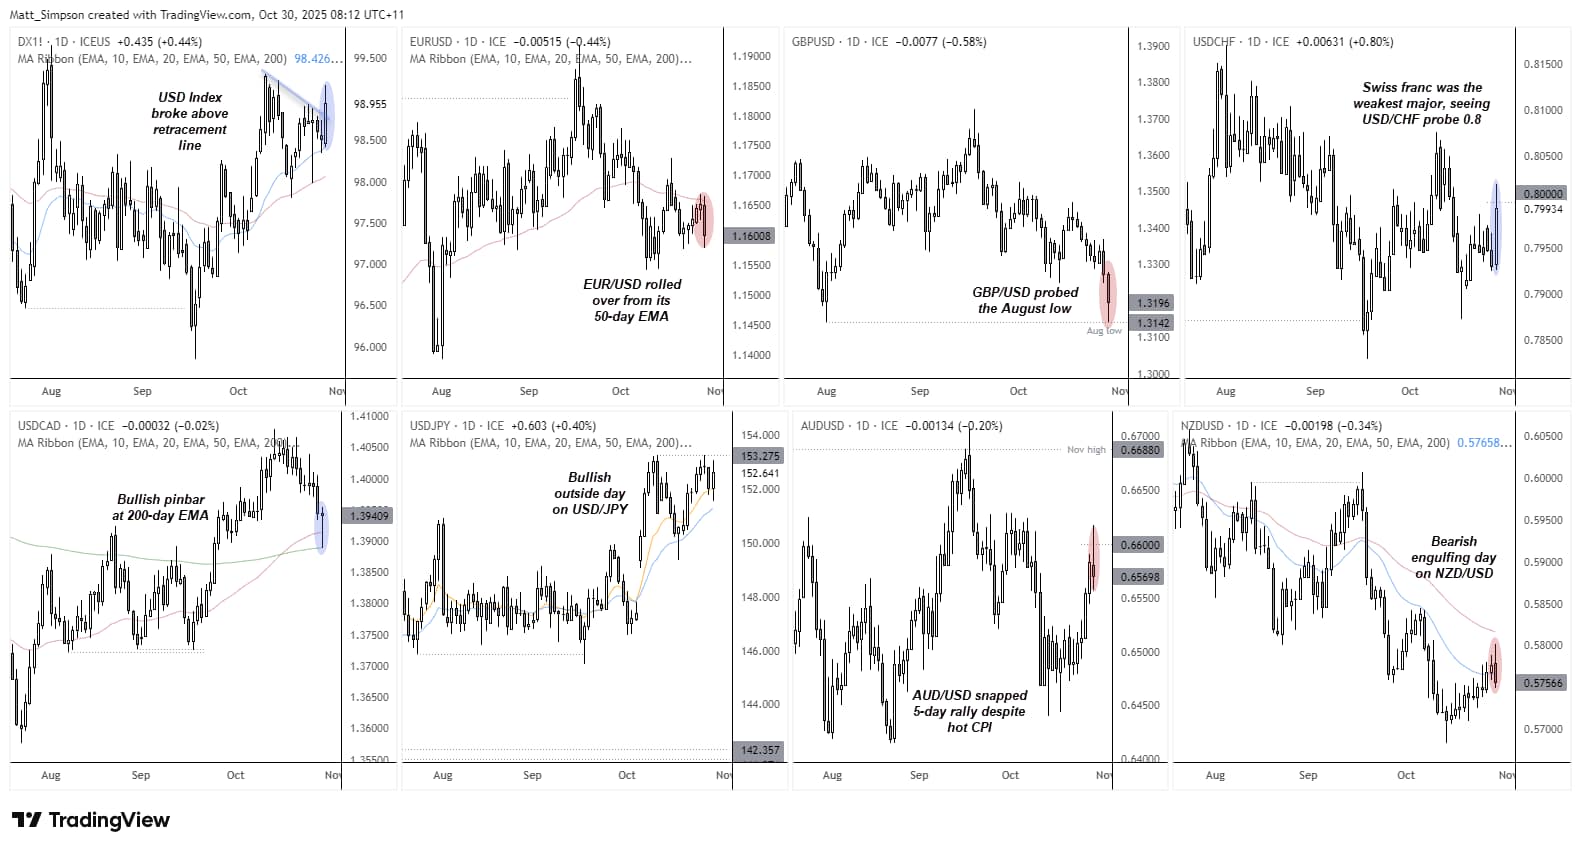
Chart analysis by Matt Simpson - source: TradingView

USD/JPY Technical Analysis: US Dollar vs Japanese Yen
A bullish outside day formed on USD/JPY, leaving prices within one average daily range of the October double-top high. However, options markets show little conviction for a bullish breakout. Risk reversals for the Japanese yen have continued to fall, indicating a rise in put demand (bearish bets) relative to calls on USD/JPY. That risk sentiment — which grew more bearish after Jerome Powell’s press conference — suggests traders are not expecting further upside and may be positioning for a dovish tone from the Bank of Japan at this week’s meeting.
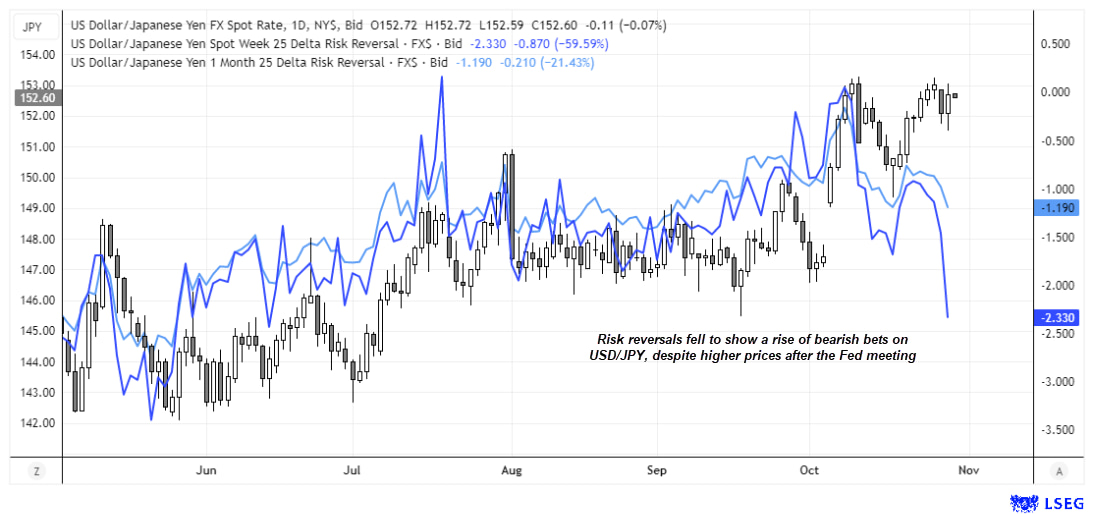
Chart analysis by Matt Simpson - data source: LSEG
USD/JPY Faces Double-Top Resistance as RSI Divergence Signals Weakness
The daily chart shows a bullish outside day on USD/JPY, yet options traders appear to be betting on a lower move ahead of the Bank of Japan meeting. A bearish divergence has developed on the daily RSI (14) alongside a double top, suggesting that upside momentum may be limited from here.
Momentum remains predominantly bullish on the one-hour chart, with RSI (14) trending higher and not yet overbought. The near-term bias is therefore for an attempt to break the double-top high at 153.28 before prices potentially reverse lower — aligning with the broader bearish bias outlined in yesterday’s report.
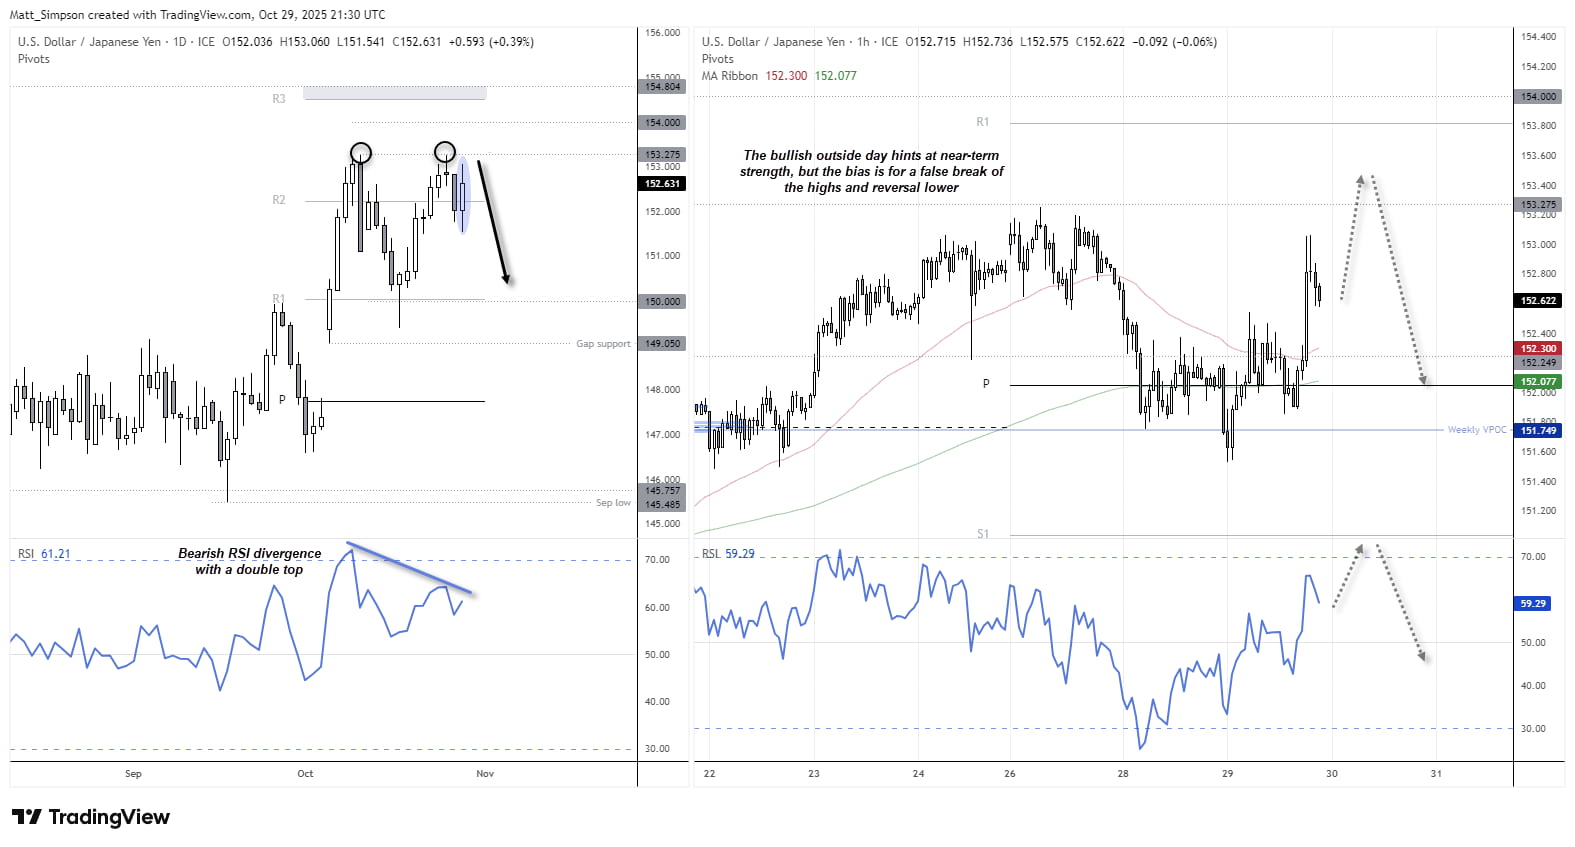
Chart analysis by Matt Simpson - data source: TradingView USD/JPY

AUD/USD Technical Analysis: Australian Dollar vs US Dollar
The picture among options traders looks quite different for the Australian dollar compared with the Japanese yen. In this case, risk reversals are trending higher alongside spot prices, showing a rise in call demand (bullish bets) relative to puts (bearish bets). This suggests any pullback in AUD/USD could be limited ahead of its next potential leg higher.
Australia’s Q3 CPI data came in hotter than expected across all key measures. Not only does this dampen hopes of a rate cut next week — or even this year — but it also raises the possibility that the RBA has already reached the terminal rate of its easing cycle at 3.35%. Should upcoming US data tilt dovish and reinforce expectations of Fed cuts, AUD/USD could continue to trend higher into the new year.
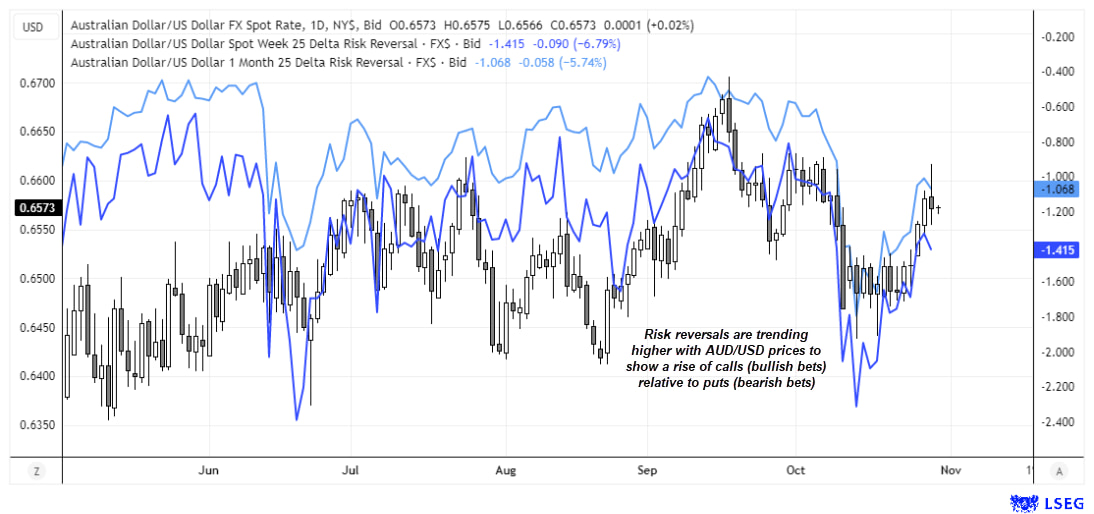
Chart analysis by Matt Simpson - data source: LSEG
AUD/USD Pulls Back From 0.66 With Bearish Pinbar
The less-dovish-than-expected FOMC meeting overshadowed Australia’s strong CPI report, prompting AUD/USD to snap a five-day winning streak and form a bearish pinbar around the 0.66 handle — near the October VPOC and monthly pivot point. The one-day bearish reversal candle also dragged the daily RSI (2) down from overbought territory. While this points to a short-term pullback or consolidation, any downside move from here is likely to be limited.
On the one-hour chart, a bullish pinbar and doji have formed around the weekly R2 pivot point with the RSI (2) deeply oversold. A minor bounce seems plausible during the Asian session, though bears may re-emerge to drive prices lower toward the weekly R1 (0.6573) or upper gap support (0.6528).
Should a retracement lower occur, I will look for evidence of a swing low on the daily chart to anticipate the next leg higher for the Australian dollar.

Chart analysis by Matt Simpson - source: TradingView AUD/USD
View the full economic calendar
-- Written by Matt Simpson
Follow Matt on Twitter @cLeverEdge
How to trade with City Index
You can trade with City Index by following these four easy steps:
- Open an account, or log in if you’re already a customer
• Open an account in the UK
• Open an account in Australia
• Open an account in Singapore
- Search for the market you want to trade in our award-winning platform
- Choose your position and size, and your stop and limit levels
- Place the trade


