


The US dollar traded mixed on Wednesday as political pressure on the Federal Reserve intensified ahead of Jerome Powell’s speech at the Jackson Hole Symposium. Meanwhile, the New Zealand dollar slumped after a dovish RBNZ cut, and UK inflation data complicated the Bank of England’s policy outlook. Flash PMIs across the US, UK, and Europe also loomed large, setting the stage for heightened volatility in forex markets.
View related analysis:
- GBP/USD Outlook: BOE Rate Cut Odds Fade as UK Inflation Stays Hot
- USD/CAD Technical Outlook: Futures Traders move Against the Canadian Dollar
- AUD/USD, EUR/AUD Technical Outlook: Australian Dollar Under Pressure
US Dollar Outlook Ahead of Jackson Hole, RBNZ Cut and UK CPI
New Zealand Dollar Tumbles After Dovish RBNZ Cut
The New Zealand dollar stole the volatility show on Wednesday after the Reserve Bank of New Zealand (RBNZ) delivered a dovish 25bp cut. The move to 3% was fully expected, but two members voted for a 50bp cut and their forecasts showed the terminal rate had been lowered to 2.55% by March, down from 2.85% in their previous Monetary Policy Review (MPR).
The New Zealand dollar was the weakest FX major and by far the most volatile, with the daily range of AUD/NZD stretching to 300% of its average daily range (ADR). AUD/NZD surged to a 5-month high in its most bullish session since April.
The Kiwi dollar also weakened against safe-haven currencies such as the Swiss franc and Japanese yen. NZD/CHF fell -1.8% to a 4-month low, while NZD/JPY dropped -1.4% to a 3-month low.
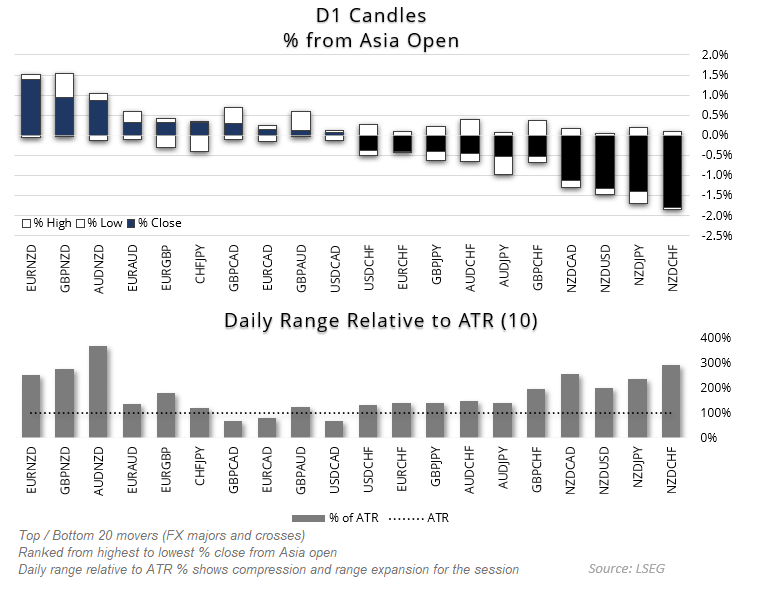
Chart prepared by Matt Simpson – data source: LSEG
UK Inflation Data Weakens BOE Rate Cut Case
The case for the Bank of England (BOE) to cut was undermined by the latest UK inflation figures. Core CPI rose to 3.8% y/y — nearly double the BOE’s 2% target — and is expected to reach 4% next month. Governor Bailey had already described the case to cut as “finely balanced” at the last meeting, but these figures tilt the scales towards a hold, particularly as 4 of the 9 MPC members previously voted to keep rates unchanged.
Even so, the British pound weakened in the hours following the CPI release. Traders assumed that higher prices would further erode an already fragile economy and ultimately lead to cuts later on. GBP/USD closed lower for a third consecutive day, GBP/EUR formed a bearish outside day, and GBP/JPY slipped to an 8-day low.
Fed Independence and Powell’s Jackson Hole Speech in Focus
The US dollar index edged slightly lower as the Fed’s independence faced renewed political pressure from President Trump, who called on Fed Governor Cook to resign amid an alleged mortgage scandal. However, the dollar’s downside was limited ahead of Jerome Powell’s upcoming speech at the Jackson Hole Symposium on Friday.
The Fed minutes revealed policymakers remain more concerned about stubborn inflation than a weaker labour market. Reports also suggest that key central bankers will publicly support Powell at Jackson Hole, reinforcing the principle of central bank independence. This aligns with my earlier assumption that Powell’s speech may disappoint doves and lend support to the US dollar heading into next week.
US Dollar Index (DXY) Technical Analysis
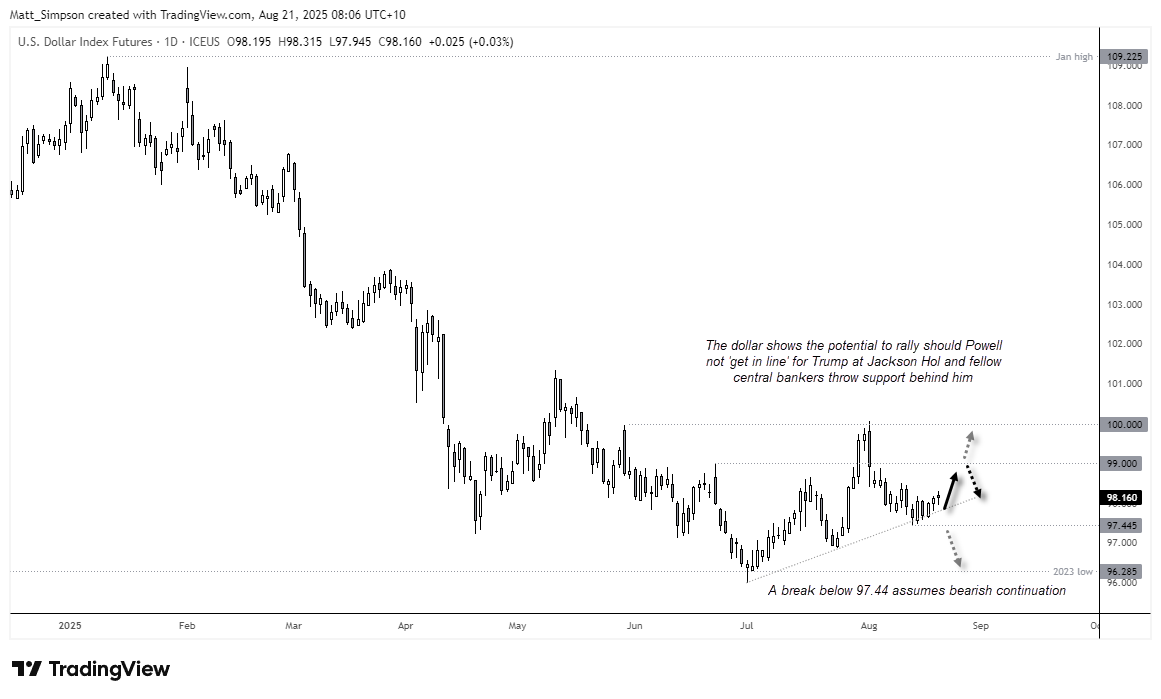
Chart analysis by Matt Simpson - data source: TradingView U.S. Dollar Index Futures
The USD index was effectively flat on Wednesday, with the daily chart producing a spinning top doji while FX majors diverged. Still, prices are holding above trend support, a technical level that it could potentially rally from if the Fed refuse to budge and fellow central bankers throw support behind Jerome Powel.
But the dollar could face quite the selloff should Powell even slightly entertain the potential for cuts beyond the one expected in September. Bears could use a break of the 97.45 low to assume a resumption of the dollar’s downtrend. But while prices remain above it, my bias remains for a move to at least 99.
US Dollar Technical Outlook Across Major Forex Pairs
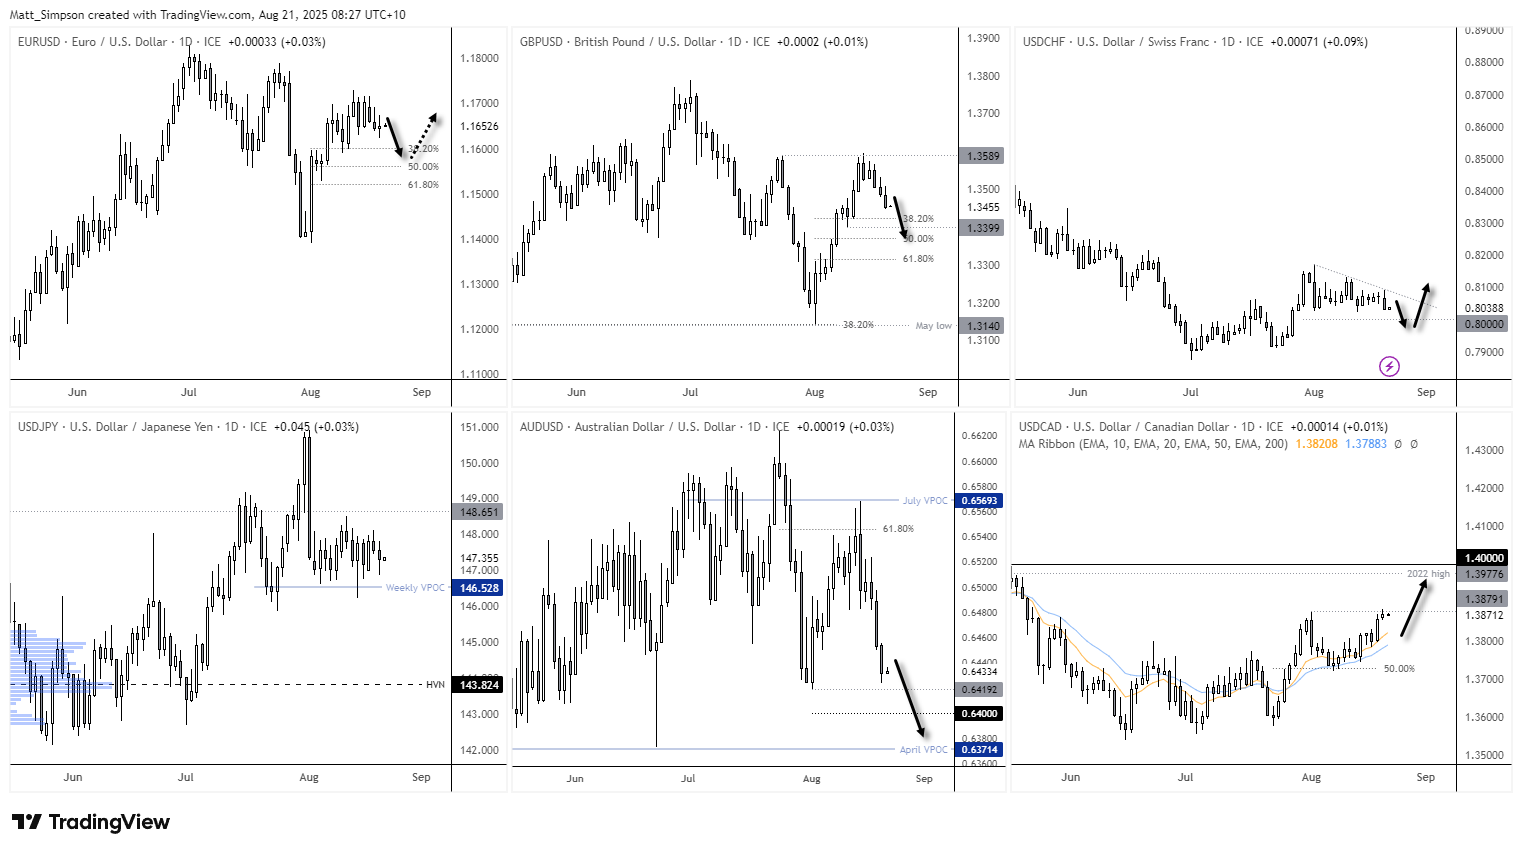
Chart analysis by Matt Simpson - data source: TradingView
EUR/USD Technical Analysis: Euro vs US Dollar
The daily chart shows the euro is hesitant to move much lower now with its doji on the daily chart, and these is a case to be made that its downside is limited given the predominantly bullish structure. This could therefore cap upside on the USD index to 99. Still, if the Fed relatively hawkish, EUR/USD could potentially pull back to the 50% retracement level around 1.1560.
GBP/USD Technical Analysis: British Pound vs US Dollar
Bearish momentum is pointing lower for GBP/USD which closed lower for a fourth day. While the daily chart shows the potential for an inverted head and shoulders pattern, downside risks remain in place over the near term when we factor in recent momentum. The 38.2% Fibonacci level (1.3424) and 1.3399 swing low are within easy reach for bears, a break beneath which brings the 50% (1.3370) and 61.8% near the 1.3 handle into focus for bears.
USD/CHF Technical Analysis: US Dollar vs Swiss Franc
The Swiss franc looks like it is preparing for some safe-haven inflows against the US dollar, with a bearish engulfing candle forming on USD/CHF on Wednesday. And this makes sense given the significance of Powell’s incoming speech.
A move down to 0.80 over the near term seems plausible, though whether it can remain beneath that big round number for long remains to be seen.
USD/JPY Technical Analysis: US Dollar vs Japanese Yen
Price action remains choppy on the daily chart of USD/JPY, making it a pair that is difficult to hold a directional bias on over the near term. I’m therefore happy to place USD/JPY on the back burner until the market tips its hand.
AUD/USD Technical Analysis: Australian Dollar vs US Dollar
Momentum has finally accelerated lower for AUD/USD and it looks set to break beneath the August low and test my 64c downside target. A break beneath which brings the April VPOC (0.6371) into focus for bears.
USD/CAD Technical Analysis: US Dollar vs Canadian Dollar
My upside target of around 1.4 remains in play for USD/CAD, though it seems hesitant to break above the earlier August high for now – as suspected. Still, with a solid bullish structure on the daily chart, I suspect bulls will be seeking dips in anticipation of a breakout and move up to at least the 2022 high (1.3978)
Key Economic Events for Traders (AEST / GMT+10)
08:45 NZD Trade Balance (Jul) (NZD/USD, AUD/NZD, NZD/JPY)
09:00 AUD Judo Bank PMIs (Aug) (AUD/USD, AUD/JPY, AUD/NZD)
09:50 JPY Foreign Bonds Buying, Foreign Investments in Japanese Stocks (USD/JPY, EUR/JPY, AUD/JPY)
10:00 USD 3-Day Jackson Hole Symposium Begins (S&P 500, Nasdaq 100, USD/JPY)
10:30 JPY au Jibun PMIs (Aug) (USD/JPY, EUR/JPY, AUD/JPY)
11:00 AUD MI Inflation Expectations (AUD/USD, AUD/JPY, AUD/NZD)
11:30 AUD Reserve Assets Total (Jul) (AUD/USD, AUD/JPY, AUD/NZD)
13:00 NZD Credit Card Spending (Jul) (NZD/USD, AUD/NZD, NZD/JPY)
17:30 EUR HCOB Germany Flash PMIs (Aug) (EUR/USD, EUR/GBP, DAX)
18:00 EUR HCOB Eurozone Flash PMIs (Aug) (EUR/USD, EUR/GBP, DAX)
18:30 GBP S&P Global Flash PMIs (Aug) (GBP/USD, EUR/GBP, FTSE 100)
19:00 EUR Construction Output (Jun) (EUR/USD, EUR/GBP, DAX)
20:00 GBP CBI Industrial Trends Orders (Aug) (GBP/USD, EUR/GBP, FTSE 100)
20:00 EUR German Buba Monthly Report (EUR/USD, EUR/GBP, DAX)
21:30 USD FOMC Member Bostic Speaks (S&P 500, Nasdaq 100, USD/JPY)
22:30 USD Continuing Jobless Claims, Jobless Claims, Philadelphia Fed Manufacturing Index (Aug) (S&P 500, Nasdaq 100, USD/JPY)
22:30 CAD IPPI, RMPI (Jul) (USD/CAD, EUR/CAD, CAD/JPY)
23:45 USD S&P Global Flash PMIs (Aug) (S&P 500, Nasdaq 100, USD/JPY)
00:00 USD Home Sales (Jul), US Leading Index (Jul) (S&P 500, Nasdaq 100, USD/JPY)
00:00 EUR Consumer Confidence (Aug) (EUR/USD, EUR/GBP, DAX)
00:30 USD Natural Gas Storage (WTI Crude, Brent Crude, USD/CAD)
03:00 USD 30-Year TIPS Auction (S&P 500, Nasdaq 100, USD/JPY)
06:30 USD Fed's Balance Sheet, Reserve Balances with Federal Reserve Banks (S&P 500, Nasdaq 100, USD/JPY)
View the full economic calendar
-- Written by Matt Simpson
Follow Matt on Twitter @cLeverEdge
How to trade with City Index
You can trade with City Index by following these four easy steps:
- Open an account, or log in if you’re already a customer
• Open an account in the UK
• Open an account in Australia
• Open an account in Singapore
- Search for the market you want to trade in our award-winning platform
- Choose your position and size, and your stop and limit levels
- Place the trade


