The US dollar enters April with a clear seasonal headwind, as historical data shows a strong tendency for weakness across FX majors. However, this year’s outlook is far from straightforward. Geopolitical tensions in the Middle East, elevated oil prices, and shifting expectations around US interest rates could easily override seasonal patterns. Traders must now weigh whether history repeats—or whether macro and geopolitical forces take control.
View related analysis:
- US Dollar Hits 11-Month High, GBP/USD Breaks Support, FX Signals Mixed
- FX Futures Positioning: US Dollar, EUR/USD, USD/JPY | COT report
- Gold Price Outlook: Dead Cat Bounce Risk as Bearish Signals Build
- AUD/USD Outlook 2026: Key Drivers for the Australian Dollar in Q2
US Dollar April Outlook: Seasonality Turns Bearish as Middle East Risks Loom
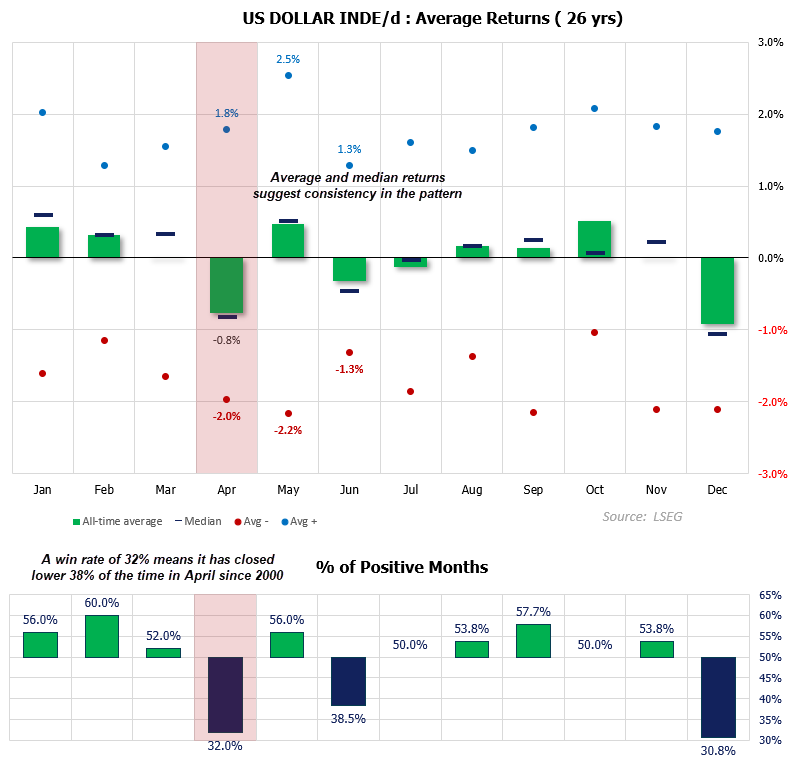
Using monthly data since the turn of the century shows the US dollar index has a slight bullish bias, with six months closing higher, four lower, and two flat. However, April stands out as a clear weak spot, with both average and median returns skewed to the downside.
Source: ICE, LSEG
April seasonality points to a weaker US dollar
- With a win rate of just 32%, the US dollar index has closed lower in April 68% of the time. It has also posted average returns of -0.77% and median returns of -0.8%.
- The close alignment between the mean and median suggests the data is relatively consistent and not distorted by outliers, making the 68% loss rate more compelling.
- Among those negative months, the US dollar has delivered an average loss of -2%, only slightly larger than the average gain of 1.8% during positive months.
Geopolitics to Dictate Whether Seasonality Plays Out
Whether the US dollar follows its seasonal tendency will largely depend on whether the war in the Middle East genuinely de-escalates. Seasonality reflects averages of past outcomes and can easily be overridden by major drivers such as geopolitical shocks or recessions. If the war drags on or the Strait of Hormuz remains closed, the US dollar could break higher and defy its seasonal pattern.
However, if the US withdraws and the Strait of Hormuz reopens, traders could shift their focus back to softer US employment data and reprice rate cuts, knowing a key inflationary pressure has been removed.
President Trump is set to address the nation on Wednesday night (early Thursday in Asia), so traders should be on guard for potential volatility—even if no concrete policy shift is delivered. If tensions de-escalate, incoming data such as ISM manufacturing, services, and NFP will carry far greater weight than they currently do.

US Dollar Index (DXY) Technical Analysis
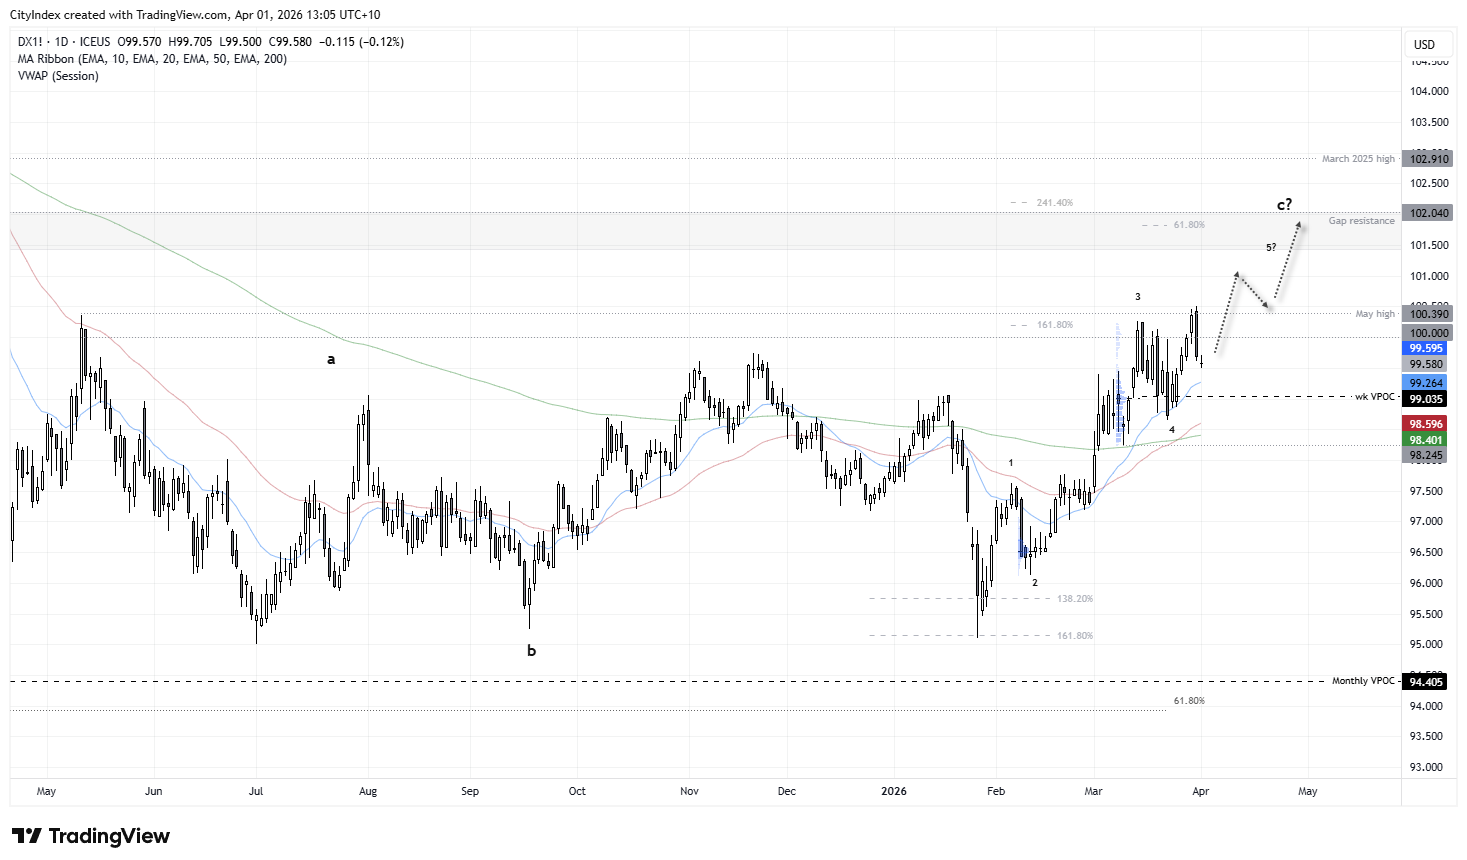
A bearish engulfing candle formed on Tuesday, seeing the US dollar retrace from its May high, in line with my near-term bias. For now, my bias remains bullish while prices hold above the 98.65 low, which I suspect marks the end of wave 4.
Bulls could therefore look for dips towards support and evidence of a swing low around the 20-day EMA (99.26) or the weekly VPOC near the 99 handle, in anticipation of a resumption of wave 5 towards 101.50 or gap resistance near 102.
As mentioned in yesterday’s report, I am ultimately looking for the completion of wave 5 and the larger wave C to mark a more meaningful top.
Source: ICE, TradingView
US Dollar Seasonality in April: FX Majors Performance (Since 2000)
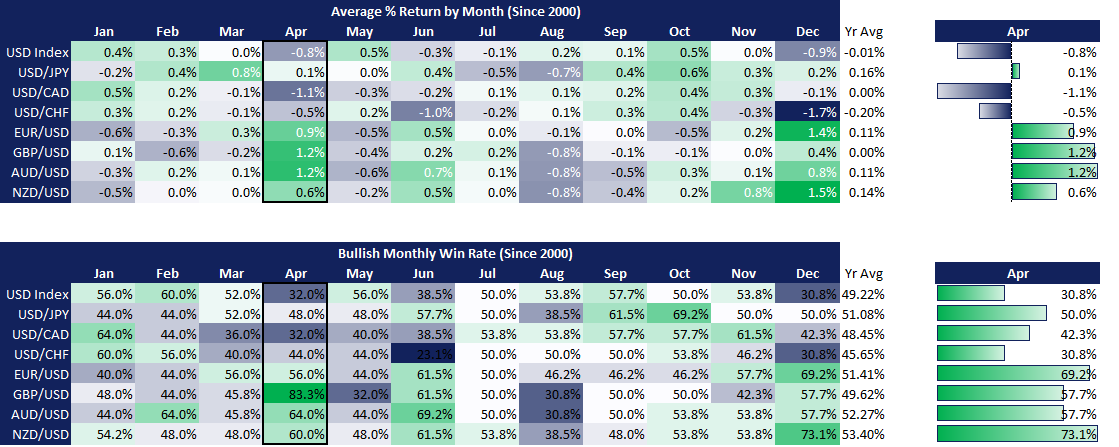
The bearish bias for the US dollar is clear when comparing its performance across FX majors, where it stands out as the weakest overall. Whether it follows that pattern again this year may hinge on what President Trump announces, alongside incoming headlines from the Middle East.
- US Dollar Index (DXY): Has closed lower 68% of the time (32% win rate), with average returns of -0.8%, making April one of the weakest months for the USD.
- EUR/USD: Rises 56% of the time with average gains of 0.9%, reinforcing a consistent seasonal bias for a softer US dollar.
- GBP/USD: One of the standout performers, climbing 83% of the time with average returns of 1.2%, highlighting strong and reliable upside seasonality.
- AUD/USD: Gains 64% of the time with average returns of 1.2%, combining a solid win rate with strong upside potential.
- NZD/USD: Advances 60% of the time with average gains of 0.6%, offering a steady but less explosive bullish profile.
- USD/JPY: Rises 48% of the time with average returns of 0.1%, effectively flat and highlighting mixed USD performance against the yen.
- USD/CAD: Falls 68% of the time (32% win rate) with average returns of -1.1%, making CAD one of the strongest currencies versus the USD in April.
- USD/CHF: Declines 56% of the time with average returns of -0.5%, pointing to modest but consistent franc outperformance.
Source: LSEG
View the full economic calendar
-- Written by Matt Simpson
Follow Matt on Twitter @cLeverEdge
How to trade with City Index
You can trade with City Index by following these four easy steps:
- Open an account, or log in if you’re already a customer
• Open an account in the UK
• Open an account in Australia
• Open an account in Singapore
- Search for the market you want to trade in our award-winning platform
- Choose your position and size, and your stop and limit levels
- Place the trade