


The US dollar is attempting to regain bullish momentum, supported by a sharp shift in futures positioning and improving technical structure on the daily chart. While near-term price action points to a potential breakout, longer-term charts continue to warn that any strength could prove corrective within a broader bearish cycle.
View related analysis:
- US Dollar Rallies Post Fed, USD/JPY Eyes 160, USD/CHF Breaks Higher
- FX Futures Positioning: USD, EUR, CHF, AUD, CAD | COT report
- Australian Dollar Price Action Setups: AUD/USD, AUD/JPY, GBP/AUD
- ASX 200 Outlook: Second-Best Day in 11 Months, FMG and GMG in Focus
US Dollar Analysis: Breakout Potential Builds as Bulls Return
US Dollar Index (DXY) Technical Analysis
The US dollar is beginning to turn higher on the daily chart, raising the potential for a breakout in line with an apparent five-wave rally. A break above 100.50 brings 101 into focus initially, while a 241.4% Fibonacci projection from an estimated wave 2 lands just above 102 – aligning with an open gap from April.
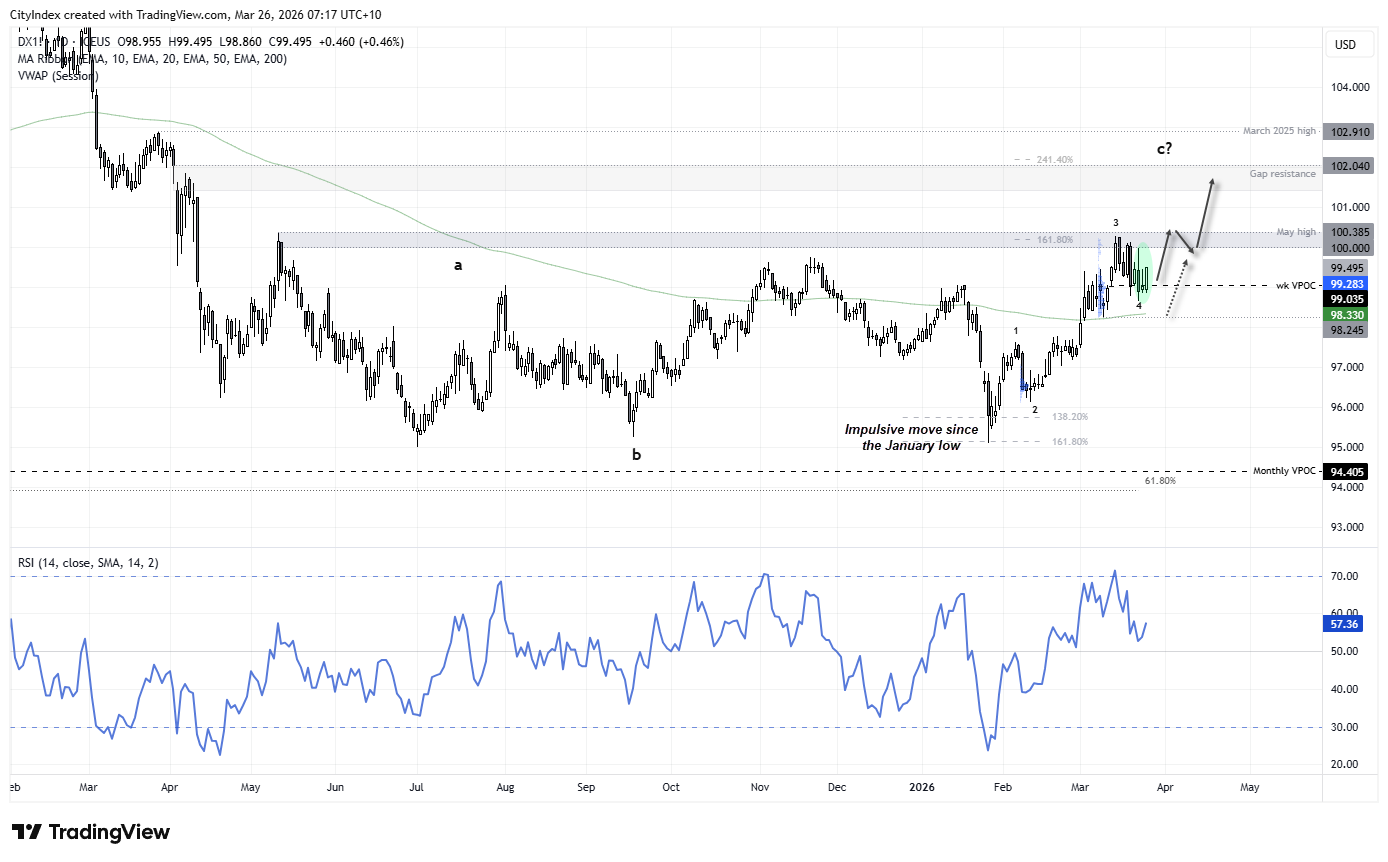
Source: ICE, TradingView
DXY Trend Structure and Elliott Wave Outlook
- The daily chart shows a strong uptrend for the USD since its January low, appearing to follow a five-wave impulsive move.
- Retracements since the apparent end of wave 2 have been shallow, which aligns with the characteristics of a wave 3 move – typically the strongest of the five.
- For now, I have labelled this month’s high as wave 3, as it sits near the classic 161.8% Fibonacci projection. The rally also stalled around 100 and the May high, adding weight to the idea that wave 3 may have completed.
- The focus now shifts to identifying the end of wave 4.

Key Support Levels for the US Dollar Index and Bullish Invalidation
The current pullback is attempting to hold above a weekly high-volume node (HVN), with bulls eyeing Monday’s low (98.65) as a potential wave 4 base. Monday’s bullish engulfing candle also completes a three-day morning star reversal pattern, hinting at building upside momentum.
However, if the US dollar sees a deeper retracement, wave 4 could extend towards the 200-day EMA (98.33). In that scenario, I would continue to monitor for signs of a swing low on the daily chart. A break beneath 98.24 would invalidate the bullish bias.
USD Index Weekly Chart Points to a More Bearish Picture
I have zoomed right out on the weekly chart to show where I think we are in the US dollar cycle. Ultimately, I suspect the 2022 high marked a significant top for the US dollar, while the January 2025 high formed a lower high in comparison – paving the way for a broader bearish impulse.
The current rally appears to be a retracement against the 2025 decline, with the recent five-wave move potentially marking the end of a wave C. If correct, this suggests the US dollar could resume the bearish trend that began in 2022 and break below 94 later this year.
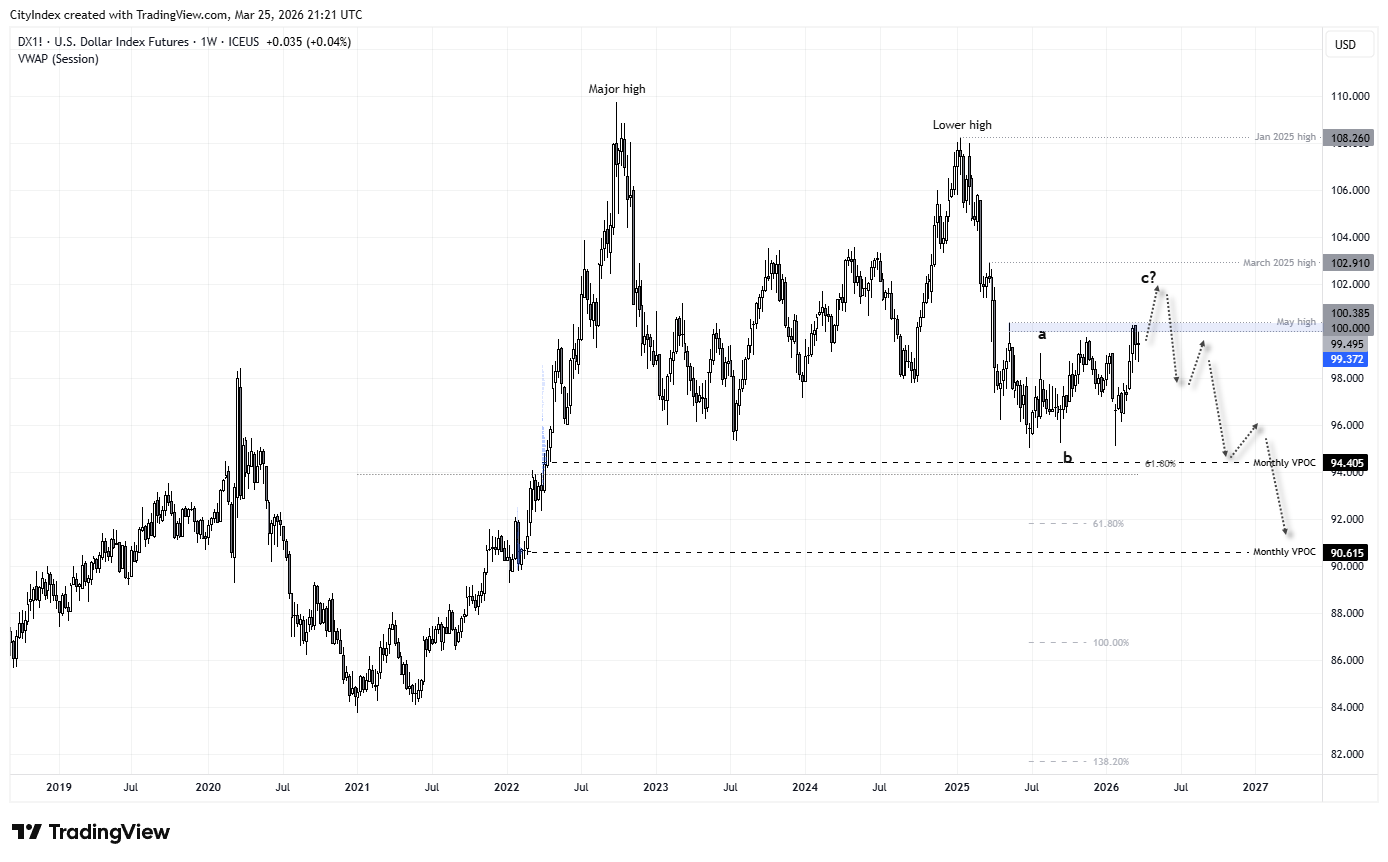
Source: ICE, TradingView

US Dollar FX Futures Positioning | COT Report
Traders flipped to net-long US dollar exposure last week in aggregate, with net-long positioning reaching $5.3 billion. The $10.9 billion increase marked the most aggressive weekly build since January 2019 and the fourth consecutive week of rising bullish exposure.
Meanwhile, asset managers lifted their net-long exposure in the US Dollar Index to a one-year high, while large speculators also flipped back to net-long positioning.
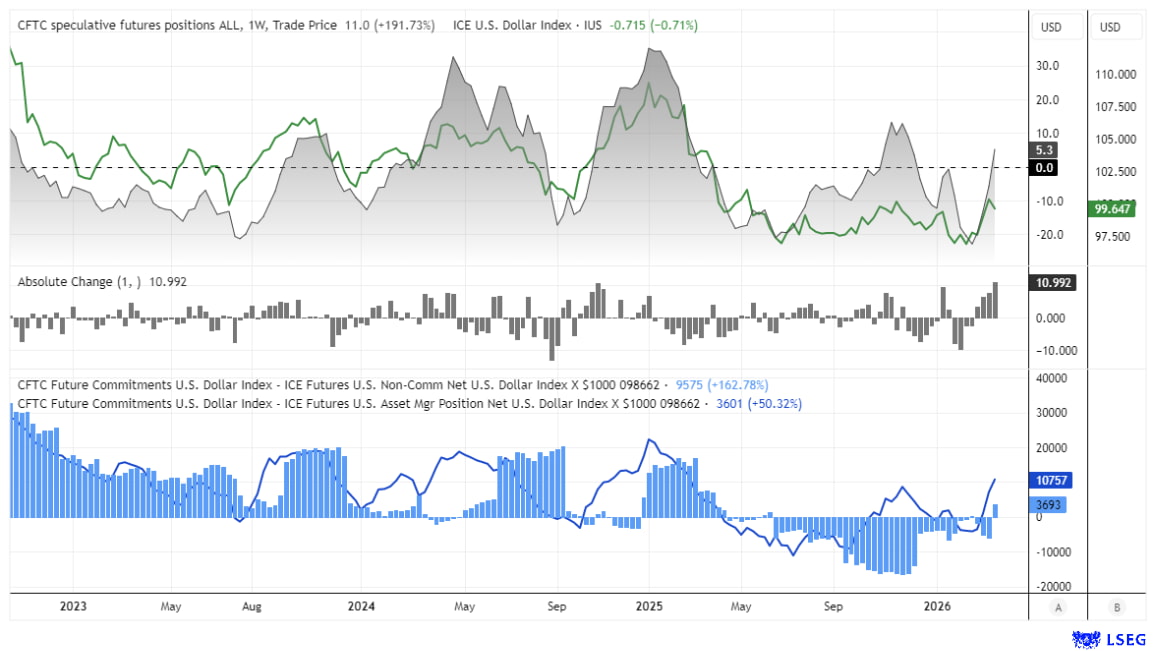
Source: ICE, CFTC (COT), LSEG
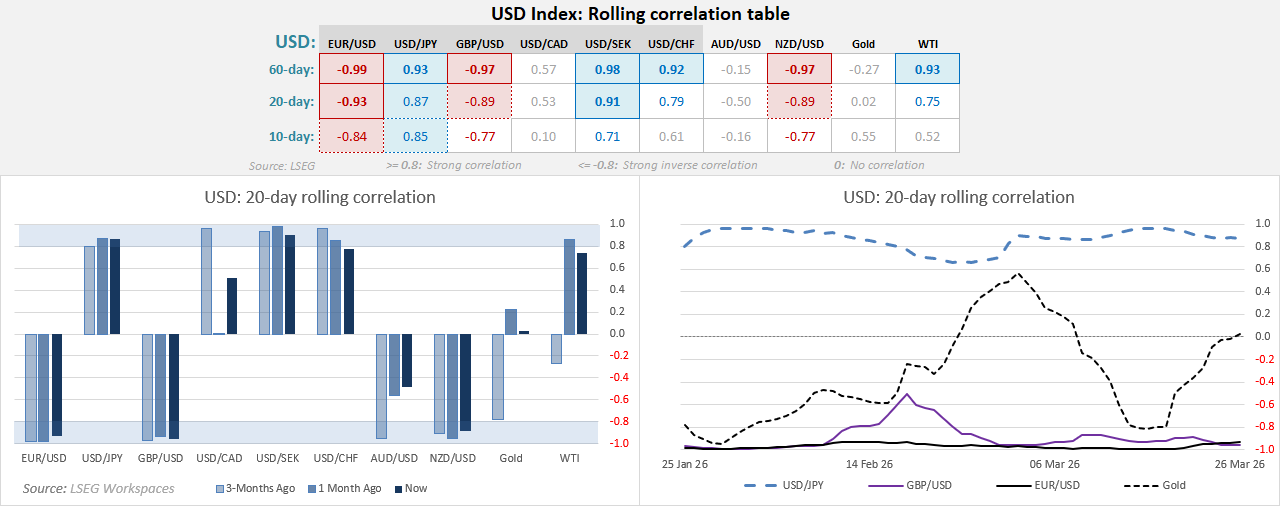
US Dollar Correlations Show Cracks Beneath the Surface
The US dollar remains the dominant driver across FX markets, with strong inverse correlations to major pairs such as EUR/USD, GBP/USD and NZD/USD—meaning they continue to fall as the USD rises. USD/JPY is still moving closely in tandem with the dollar, highlighting ongoing yen weakness, while USD/SEK and USD/CHF also show strong positive relationships. However, cracks are starting to appear beneath the surface.
The correlation with AUD/USD has weakened notably, suggesting the Australian dollar is being influenced more by its own drivers, such as China and commodities.
Meanwhile, gold’s relationship with the USD has effectively broken down, showing little correlation in the near term. Oil remains positively correlated with the dollar, likely reflecting broader inflation and macro themes. Overall, while the USD still leads, shifting correlations hint that market dynamics may be starting to evolve.
Source: LSEG
View the full economic calendar
-- Written by Matt Simpson
Follow Matt on Twitter @cLeverEdge
How to trade with City Index
You can trade with City Index by following these four easy steps:
- Open an account, or log in if you’re already a customer
• Open an account in the UK
• Open an account in Australia
• Open an account in Singapore
- Search for the market you want to trade in our award-winning platform
- Choose your position and size, and your stop and limit levels
- Place the trade


