


The US Dollar Index (DXY) is flashing early signs of a swing high after repeated rejection near 98 and a high-volume bearish outside day. Yet futures positioning tells a far less decisive story. With technicals and COT data pulling in opposite directions, traders may need to brace for choppy conditions before the next meaningful breakout unfolds.
View related analysis:
- Nasdaq 100, S&P 500 Outlook: Nvidia Strength Runs Into Resistance
- Australian Dollar Firms After CPI Keeps RBA on Tightening Track
- Bitcoin Outlook: Is 60k the Bounce Zone or a Trap Door to 50k?
- FX Futures Positioning: US Dollar, GBP, JPY, AUD | COT report
DXY Tests Key Resistance as Diverging COT Positioning Clouds the US Dollar Outlook
US Dollar Index (DXY) Technical Analysis
Upon initial inspection, one could build a near-term bearish case for the US Dollar Index on the daily chart. Bulls repeatedly failed to push USD above 98, and a high-volume bearish outside day marked a lower high on Wednesday.
If a significant swing high has formed around 98, it could mark the end of an ABC correction, with momentum eventually realigning with the broader sell-off from December’s high. This also aligns with my bearish view for the dollar this year, where I expect it to fall below 95 as part of a much larger, bearish trend.
However, I also suspect bears may be lulled into a false sense of security over the near term. The dollar index has found support around the 20-day EMA and weekly pivot point and bulls are trying to close today’s gap. Bears may want to wait for prices to retrace within Wednesday’s range to increase the potential reward to risk ratio to the downside. A break above 98 invalidates the short bias and risks a move up to 98.50 near the 200-day EMA.
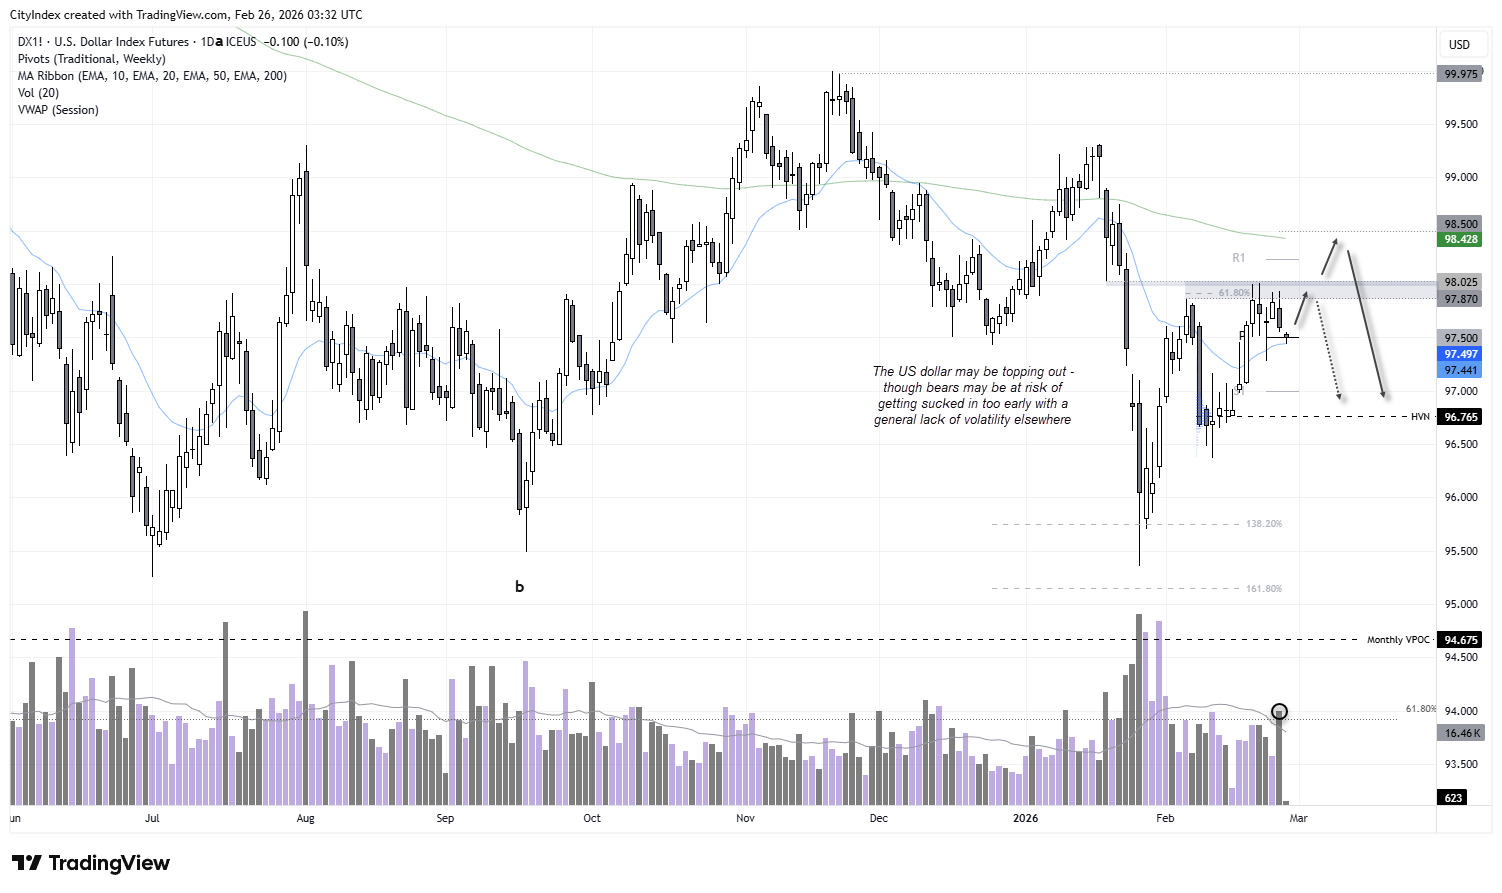
Source: ICE, TradingView

US Dollar Index (DXY) Futures Positioning | COT Report
To add further confusion to the outlook, futures traders are divided on the US dollar.
- Large speculators flipped to net-long USD Index exposure last week
- Asset managers remained net-short
- Aggregate net-short exposure to USD futures sits near a five-year extreme
When professional traders hold such divergent views, it often points to indecision rather than conviction. That suggests we may need to wait longer for a decisive breakout in the US Dollar Index. Until a clear catalyst emerges, expect choppy two-way trade, with DXY oscillating within established ranges rather than trending cleanly.
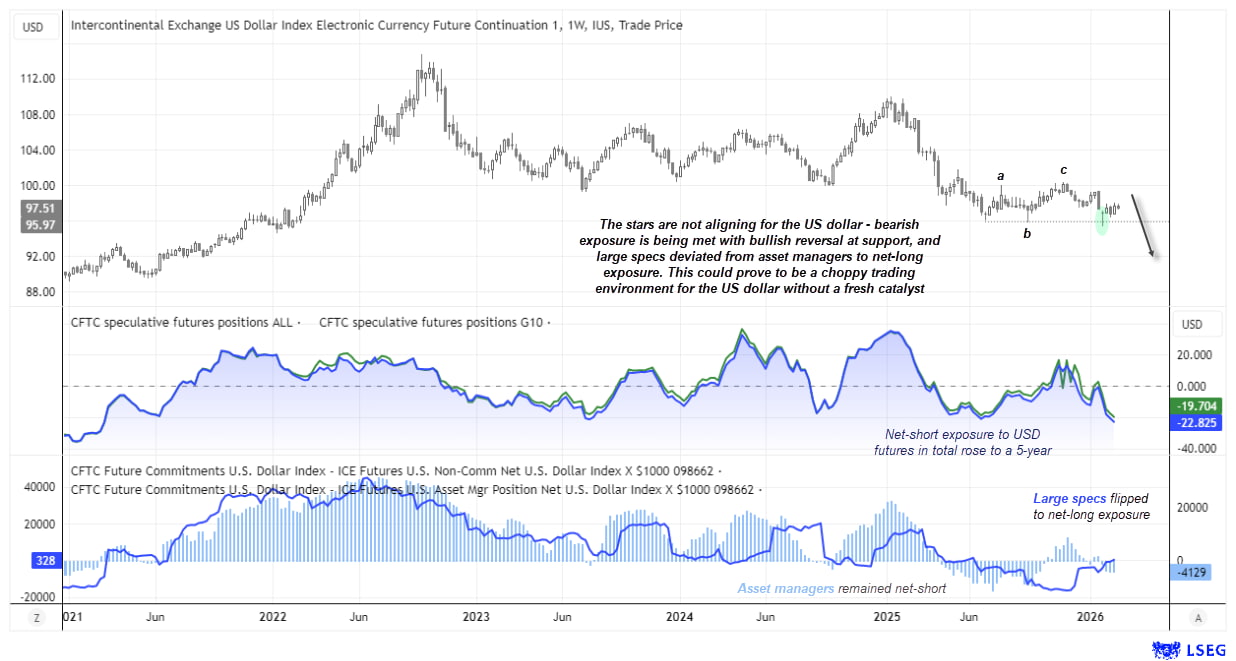
Chart analysis by Matt Simpson - Source: TradingView
View the full economic calendar
-- Written by Matt Simpson
Follow Matt on Twitter @cLeverEdge
How to trade with City Index
You can trade with City Index by following these four easy steps:
- Open an account, or log in if you’re already a customer
• Open an account in the UK
• Open an account in Australia
• Open an account in Singapore
- Search for the market you want to trade in our award-winning platform
- Choose your position and size, and your stop and limit levels
- Place the trade


