


While policymakers are widely expected to hold interest rates steady, rising energy prices could complicate the outlook for rate cuts. If the Federal Reserve reinforces its “higher-for-longer” narrative, the US dollar may remain supported as markets reassess the path for monetary policy.
View related analysis:
- FX Futures Positioning: USD, EUR, GBP, JPY | COT report
- Australian Dollar Outlook: RBA Rate Decision and AUD/USD Pullback Risks
- Gold Slips as Crude Oil Surges on Middle East Tensions
- US Dollar and USD/JPY Rallies Stumble Amid Iran War De-Escalation Hopes
USD Outlook: Fed Policy and Crude Oil Price Shock Ahead of FOMC
It has long been expected that the Fed will stand pat at this meeting, given economic data has remained resilient. That said, a negative NFP print briefly stirred speculation that a rate cut could arrive in the coming months, but that anticipation was short-lived due to the war in Iran.
Crude Oil Spike Reinforces the “Higher for Longer” Narrative
Now we see crude oil prices spiking while the US manoeuvres to try and reopen the Strait of Hormuz. The longer it remains technically hostile, the greater the chance we see a “higher for longer” narrative for crude oil prices. Incidentally, that also translates to a higher-for-longer narrative for Fed interest rates, even though Fed policy cannot directly influence crude oil supply disruptions.
The Fed will likely look through the initial crude oil shock given it is driven by geopolitics rather than domestic demand. However, policymakers cannot know how long the conflict will disrupt global energy markets. That uncertainty alone may be enough to delay Fed rate cuts, reinforcing the “higher for longer” narrative.
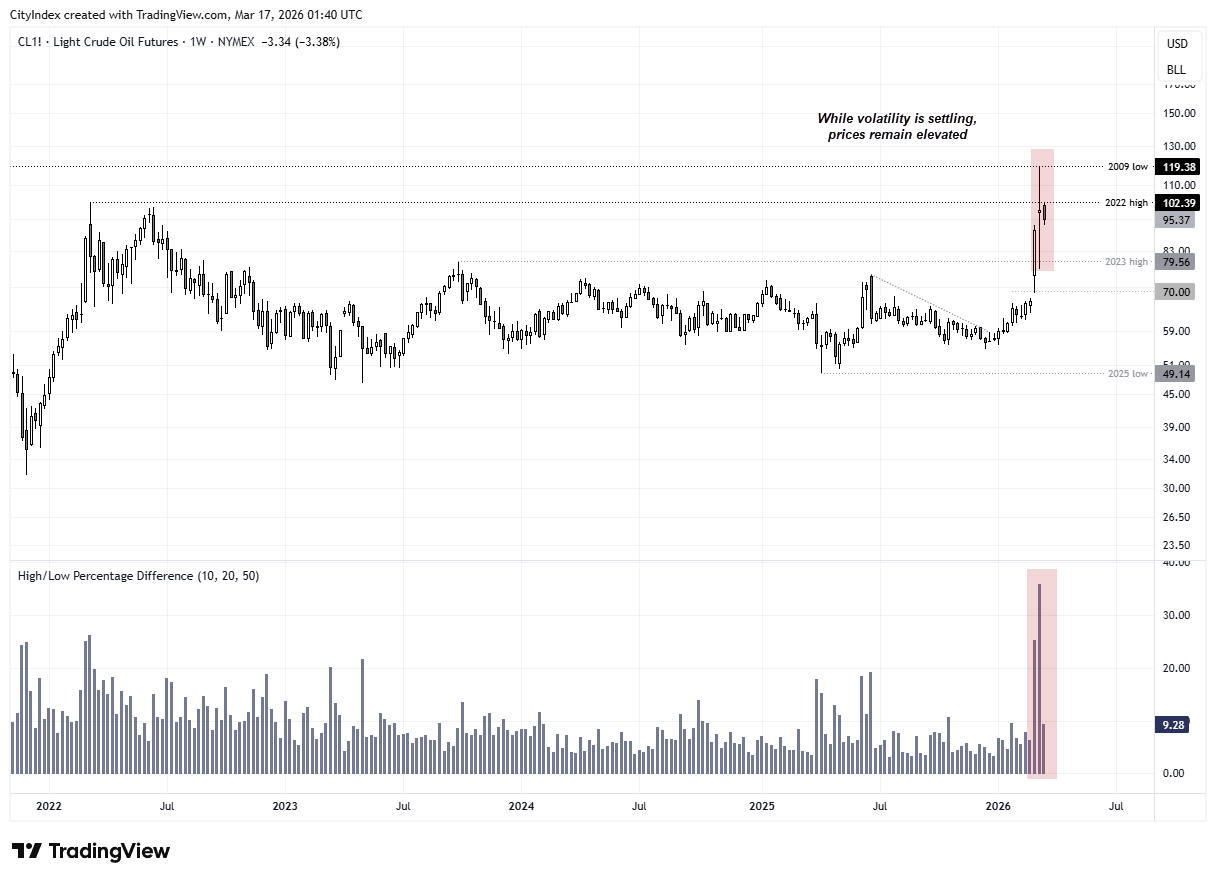
Source: NYMEX, TradingView
Why Fed Rate Cuts May Be Delayed
Sure, higher crude oil prices will filter through the supply chain and eventually reach consumers, weighing on economic growth. But that takes time to materialise. It could ultimately lead to Fed rate cuts if Middle East geopolitics were to trigger a global recession — but we are not there yet, and the Federal Reserve appears to have even less appetite to cut interest rates in the near term.
Still, that hasn’t prevented President Trump from once again calling for an emergency meeting for the Fed to cut rates. In reality, the crude oil shock is more likely to delay easing than trigger tightening, reinforcing the “higher for longer” narrative rather than forcing the Fed to hike. It seems more likely we could see the FOMC dot plot remove the solitary cut pencilled in for 2026 — which, from the President’s perspective, may feel as good as a hike.
With the prospect of “higher for longer” from the Fed and a prolonged war in Iran, the US dollar appears likely to remain supported, with dips potentially attracting buyers.

US Dollar Index (DXY) Technical Analysis
DXY Forecast: Dollar Tests Key Resistance Around 100
It has been a decent year for the US dollar so far, with the US Dollar Index rising 5.4% from the January low to Friday’s high. Yet the dollar has wobbled at the highs, forming a two-bar reversal pattern around the 100 handle. What makes this dark cloud cover particularly interesting is that we saw a similar reaction in May when the US Dollar Index last closed above 100 — a solitary daily close above the level before prices reversed lower.
The question now is whether we’ll see a decent selloff for the US dollar like we did in May, or if any dips will be short-lived. My bias is currently the latter.
DXY Technical Outlook: Fibonacci Levels and Trend Strength
The daily chart shows prices are extended from the 10 and 20-day EMAs within an otherwise decent bullish trend. In fact, I suspect this is a five-wave move and that the US dollar is currently within wave three. Note that prices have stalled just beneath the May high and around a 161.8% Fibonacci projection level. A 241.8% Fibonacci projection sits just above the 102 handle and near a yet-to-be-closed gap — hinting at a potential target for wave five.
For now, the near term matters most. Should the Fed surprise with a slightly more dovish tone, the US dollar stands a greater chance of pulling back towards 99 near a weekly VPOC. But given the strength of the trend, dip buyers could emerge and help the dollar break above the May high, bringing the 101 and 102 handles into focus.
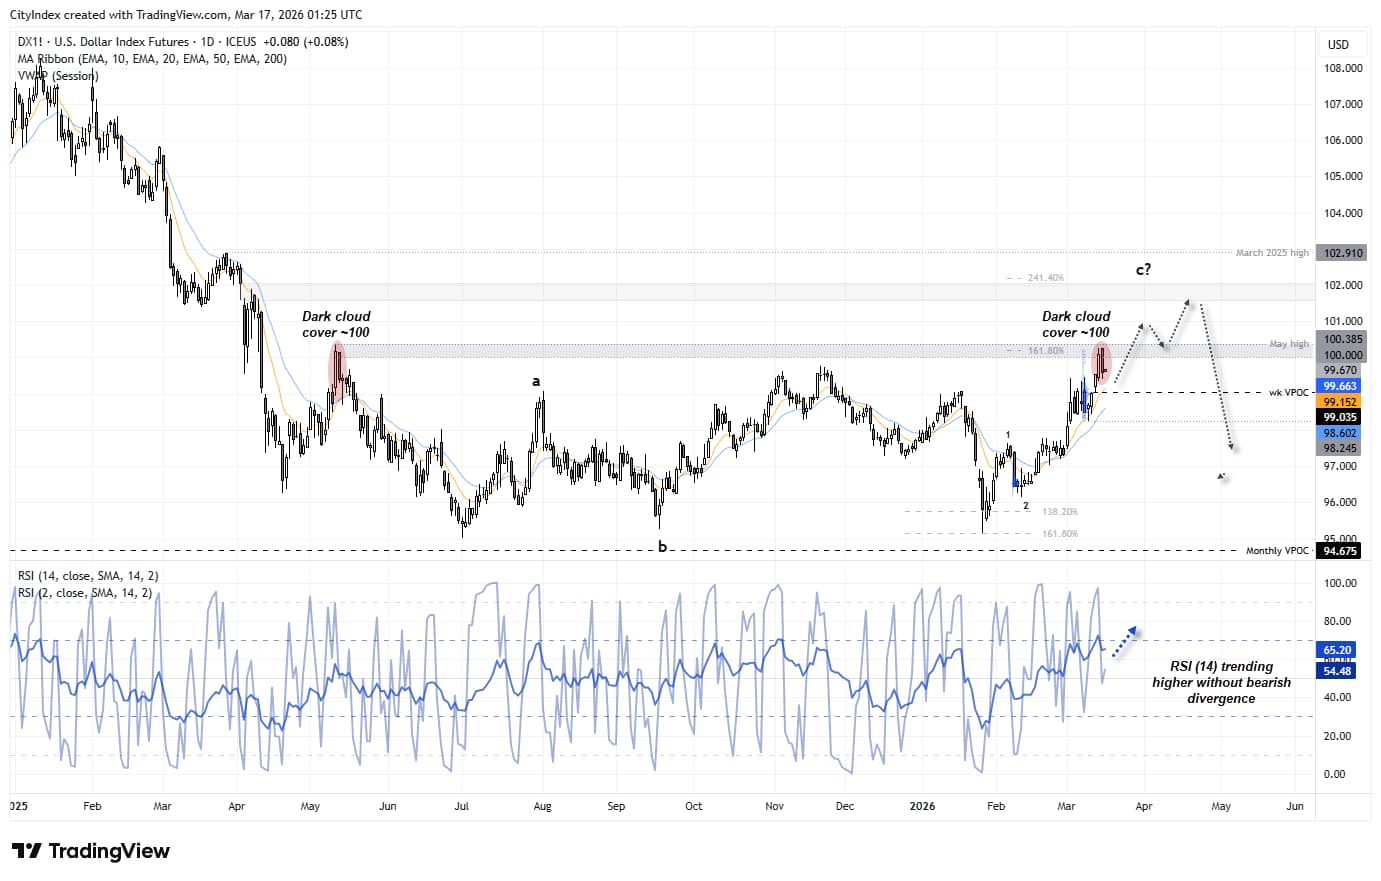
Source: ICE, TradingView
US Dollar Index (DXY) Futures Positioning | COT Report
Futures traders continued to shy away from US dollar short bets, with aggregate net-short exposure narrowing to -$5.7 billion. That represents a $7.4 billion reduction in net-short exposure and marks the third consecutive weekly decline. Meanwhile, asset managers increased their net-long exposure to the US Dollar Index to a 14-week high.
If the war continues and the Fed reinforces the “higher-for-longer” narrative, traders may ultimately revert to net-long exposure in nominal terms.
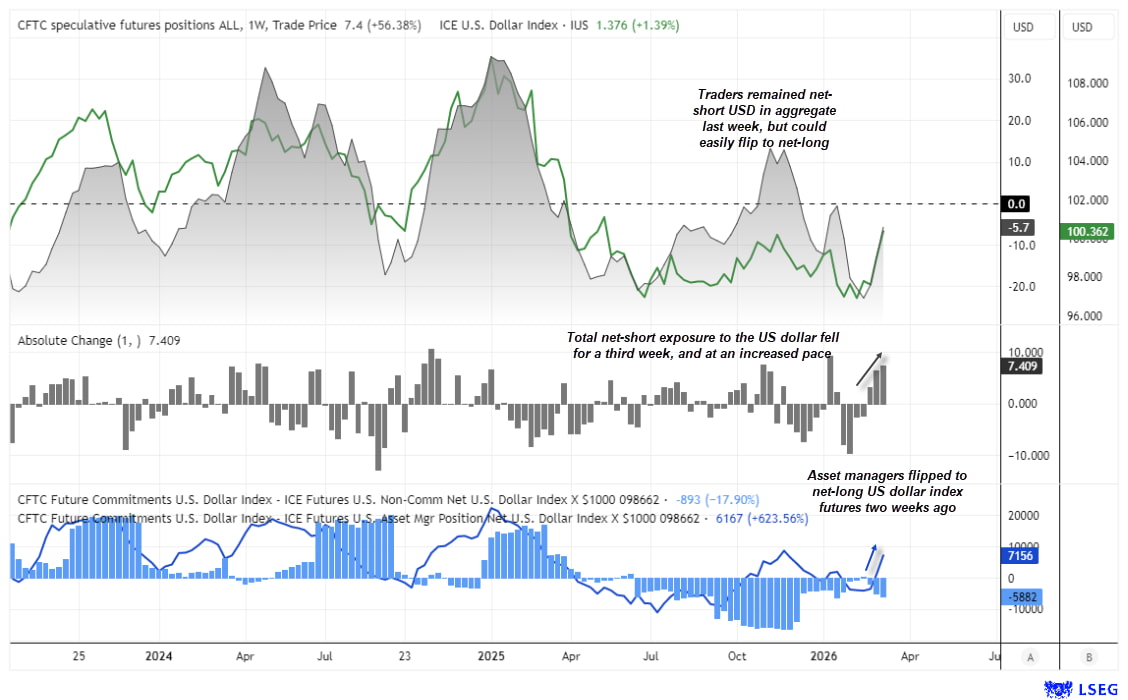
Source: ICE, CFTC (COT), LSEG
View the full economic calendar
-- Written by Matt Simpson
Follow Matt on Twitter @cLeverEdge
How to trade with City Index
You can trade with City Index by following these four easy steps:
- Open an account, or log in if you’re already a customer
• Open an account in the UK
• Open an account in Australia
• Open an account in Singapore
- Search for the market you want to trade in our award-winning platform
- Choose your position and size, and your stop and limit levels
- Place the trade


