
The US dollar index traded within three points of the 100 handle on Monday, closing at a six-month high. I outlined 100 as a potential upside target for bulls a few weeks back, and if momentum turns lower from here, it could mark wave C of a flat ABC correction. Still, this remains a pivotal area for both bulls and bears, with the ISM Non-Manufacturing and ADP reports setting the stage for a highly anticipated Nonfarm Payrolls (NFP) release on Friday.
Incoming data will shape Federal Reserve (Fed) policy expectations for December, following the relatively hawkish cut delivered last week. Fed funds futures currently imply a 67.3% chance of a cut — still reflecting confidence in further easing but well down from the ~90% probability priced in ahead of last week’s FOMC meeting. How upcoming US data lands will directly influence the dollar’s direction through traders’ confidence in that December cut.
View related analysis:
- US Dollar Eyes Breakout as EUR/USD, GBP/USD Probe Support, USD/JPY Rallies
- Australian Dollar Outlook: RBA, US ISM and ADP In Focus
- Gold Shows Tentative Signs Of Stability, Options Hint At Mild Recovery
- ASX 200 Morning Market Outlook: Bulls Eye Rebound, RBA Up next
- ASX 200 Morning Market Outlook: Bearish Reversal Pattern For October
US Dollar Index (DXY) Technical Analysis
The daily chart shows a small shooting star candle forming just below the 100 handle. While textbooks often suggest this could mark a meaningful swing high, caution is warranted given key upcoming US economic events — meaning some wriggle room around the 100 handle should be factored in this week. However, with the daily RSI (2) overbought for a third day, a minor pullback could be due.
That said, with both the weekly and daily RSI (14) confirming the rally — and neither timeframe overbought — I suspect the US dollar index may still try to reach 101 before wave C completes. A weak NFP report, however, could quickly see Fed cut expectations repriced and send the dollar lower.
For now, I’m looking for a minor pullback on the daily chart, which could support the Australian dollar — particularly if the RBA delivers a relatively hawkish hold.

Chart analysis by Matt Simpson - data source: TradingView U.S. Dollar Index Futures

AUD/USD Technical Analysis: Australian Dollar vs US Dollar
Yield Spreads and Options Positioning Signal Limited Downside for the Aussie
The correlation between Australian yields and options positioning suggests the pullback for the Aussie could be limited. The 2-year yield continues to trend higher, and the AU-US 2-year yield spread has also climbed sharply ahead of AUD/USD. While the 1-day implied volatility for AUD/USD has risen to a three-day high, both the 1-week and 1-month implied volatility levels remain subdued. Furthermore, risk reversals indicate that call demand (bullish bets) continues to hold firm against put demand (bearish bets).

Chart prepared by Matt Simpson - data source: LSEG

Rickshaw Doji Hints at Waning Bearish Momentum in AUD/USD
The Australian dollar closed lower for a fourth day, though the rickshaw man doji suggests bearish momentum is waning. Monday’s low held above the September low, highlighting tentative support. With a shooting star candle forming on the US dollar index and the potential for the RBA to deliver a hawkish hold, my bias is for AUD/USD to stage a near-term bounce while the US dollar undergoes a minor pullback.
However, given my broader bias for the US dollar to push higher before wave C completes, any recovery in the Aussie may prove limited after the initial rebound.
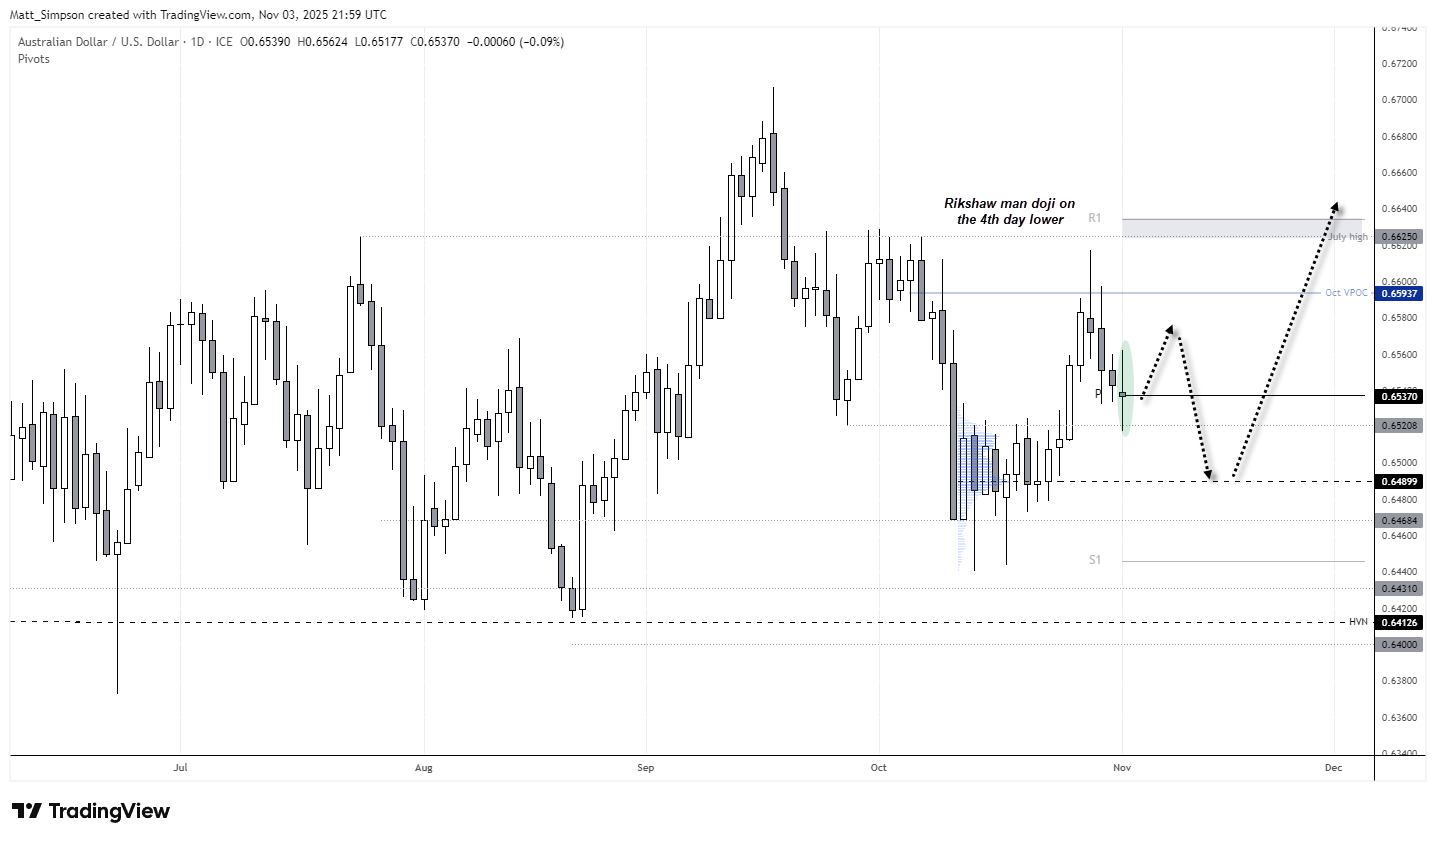
Chart analysis by Matt Simpson - data source: TradingView AUD/USD
Key Economic Events for Traders (AEDT / GMT+11)
06:00 USD Fed Governor Cook Speaks, Loan Officer Survey (S&P 500, Nasdaq 100, USD/JPY)
11:30 JPY au Jibun Bank Manufacturing PMI (Oct) (USD/JPY, EUR/JPY, Nikkei 225)
14:30 AUD RBA Interest Rate Decision & Statement (Nov) (AUD/USD, AUD/JPY, ASX 200)
15:30 AUD RBA Monetary Policy Statement (AUD/USD, AUD/NZD, ASX 200)
18:40 EUR ECB President Lagarde Speaks (EUR/USD, EUR/GBP, DAX)
19:00 NZD RBNZ Financial Stability Report (NZD/USD, AUD/NZD, NZD/JPY)
21:00 EUR ECB President Lagarde Speaks (EUR/USD, EUR/GBP, DAX)
21:30 EUR German 2-Year Schatz Auction (EUR/USD, EUR/GBP, DAX)
22:35 USD FOMC Member Bowman Speaks (S&P 500, Nasdaq 100, USD/JPY)
23:00 EUR German Buba Balz Speaks (EUR/USD, EUR/GBP, DAX)
23:00 USD Milk Auctions (NZD/USD, AUD/NZD, NZD/JPY)
View the full economic calendar
-- Written by Matt Simpson
Follow Matt on Twitter @cLeverEdge
How to trade with City Index
You can trade with City Index by following these four easy steps:
- Open an account, or log in if you’re already a customer
• Open an account in the UK
• Open an account in Australia
• Open an account in Singapore
- Search for the market you want to trade in our award-winning platform
- Choose your position and size, and your stop and limit levels
- Place the trade