


The US dollar is holding above key trend support ahead of Thursday’s US PPI data, with markets betting heavily on a September Fed rate cut amid political pressure from President Trump. Wall Street’s record close and softer yields have fuelled risk appetite, while AUD/USD traders turn their attention to Australia’s jobs report for fresh clues on the Reserve Bank of Australia’s policy outlook.
View related analysis:
- AUD/USD Softens, ASX Hits Record as RBA Cuts and Lowers Cash Rate Projection
- AUD/USD Weekly Outlook: RBA Set for Cautious Cut as US CPI Looms
- USD Selloff Stabilises Amid Mixed ISM, Trump’s Fed Pick
USD Holds Above Trend Support as AUD/USD Awaits Jobs Data
Markets Bet on September Fed Cut as Trump Pressure Campaign Intensifies
Wall Street hit a fresh record high, while the US dollar fell for a second day alongside Treasury yields on renewed confidence in Fed rate cuts. Core US inflation rose to a five-month high of 3.1% y/y — above the 3% forecast and 2.9% prior — but investors noted little evidence that tariffs are driving prices higher.
US Treasury Secretary Scott Bessent has been touting the idea of a 50bp cut, hinting that the Fed might have acted already if it had the latest employment data. Fed funds futures now price a 94.3% probability of a September cut, with some murmurs of a possible 50bp move. While I doubt the Fed will go that far, the pressure to ease is clearly building.
President Trump’s expanding list of candidates to replace Jerome Powell has grown to at least 11 names, several of whom are current or former Fed board members. The strategy appears aimed at nudging current members toward voting for a cut by dangling the Fed’s top job in front of them. The drop in yields and the US dollar suggests markets think it could work — though I still see a 25bp cut as more likely, followed by similar moves in November and December.

US Dollar Index (DXY) Technical Analysis
The 4-week retracement higher for the US Dollar Index may have run its course. I outlined a countertrend bias back near the lows when social media was mostly siding with a lower dollar, so pleased to see it reached my 100 target before reversing lower.
A small bearish inside week formed last week, and prices have since broken beneath its low. The daily chart shows a lower high around the monthly pivot point, with prices teasing a retracement line. It seems quite likely this will break in due course, though we should be on guard for at least a pause or minor bounce before losses are assumed to continue. A break below 97 also clears the weekly S1 pivot and brings the 2023 low into focus, just above the 96 handle.
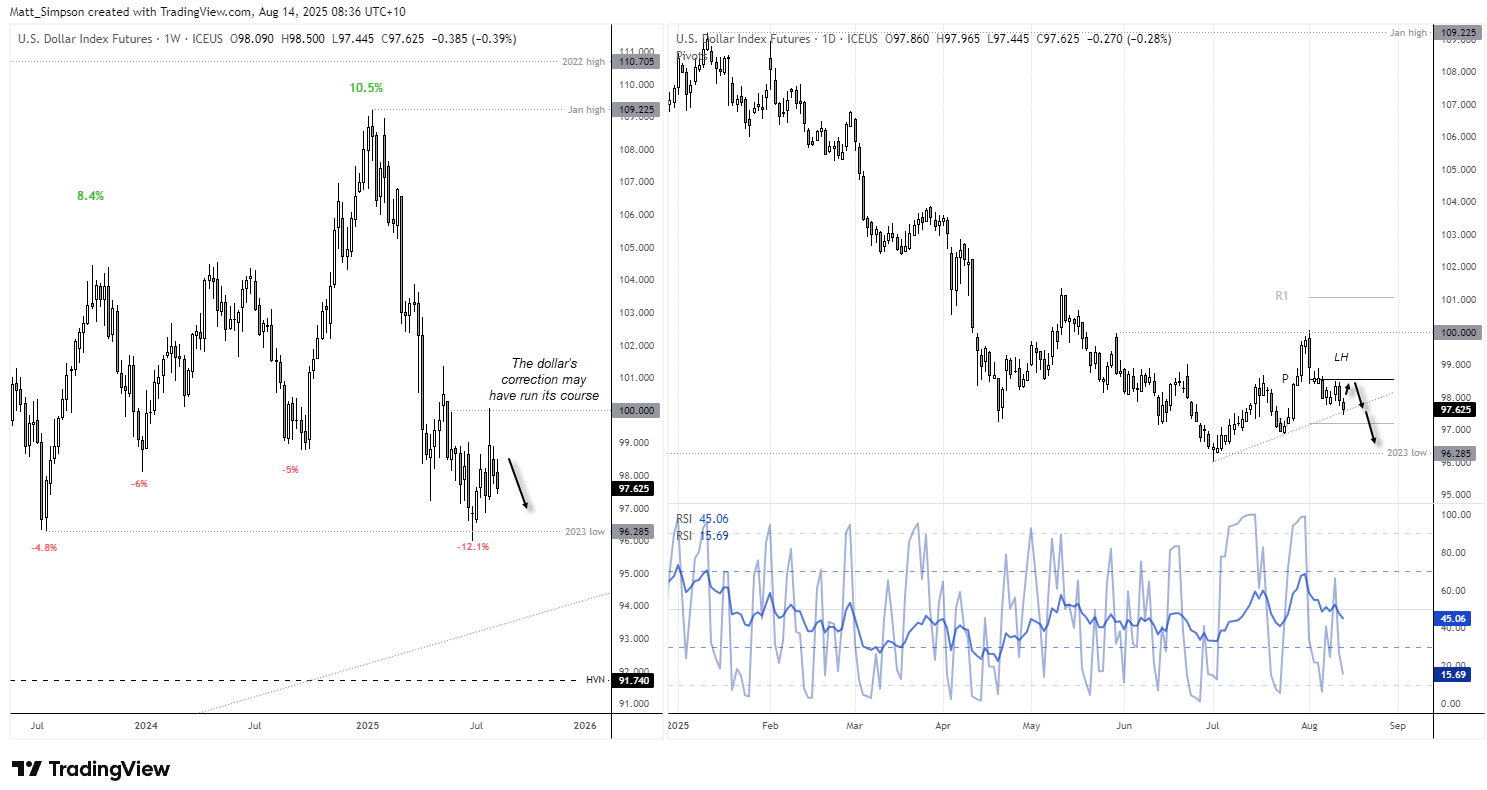
Chart analysis by Matt Simpson - data source: TradingView U.S. Dollar Index Futures
Australian Employment Data Could Shift RBA Rate Cut Odds
Australia’s wage price index rose 3.4% y/y, slightly above the 3.3% expected and up from 3.2% prior. This is unlikely to make the Reserve Bank of Australia (RBA) any less cautious on the outlook, with the Bank again citing uncertainty when delivering its 25bp cut this week. With rates now at 3.6%, RBA cash rate futures imply a 51% chance of another cut on September 30, though these odds could rise if today’s employment figures show further deterioration.
Last month’s report showed unemployment rising to a 3.5-year high of 4.3%. While still low by historical standards, the 0.2 percentage point increase was the sharpest in 11 months and marked a fifth straight month above its 12-month average. Full-time jobs fell by 38.2k. A similar set of figures today could weigh on the Australian dollar’s rally — especially with the US dollar index holding above trend support.
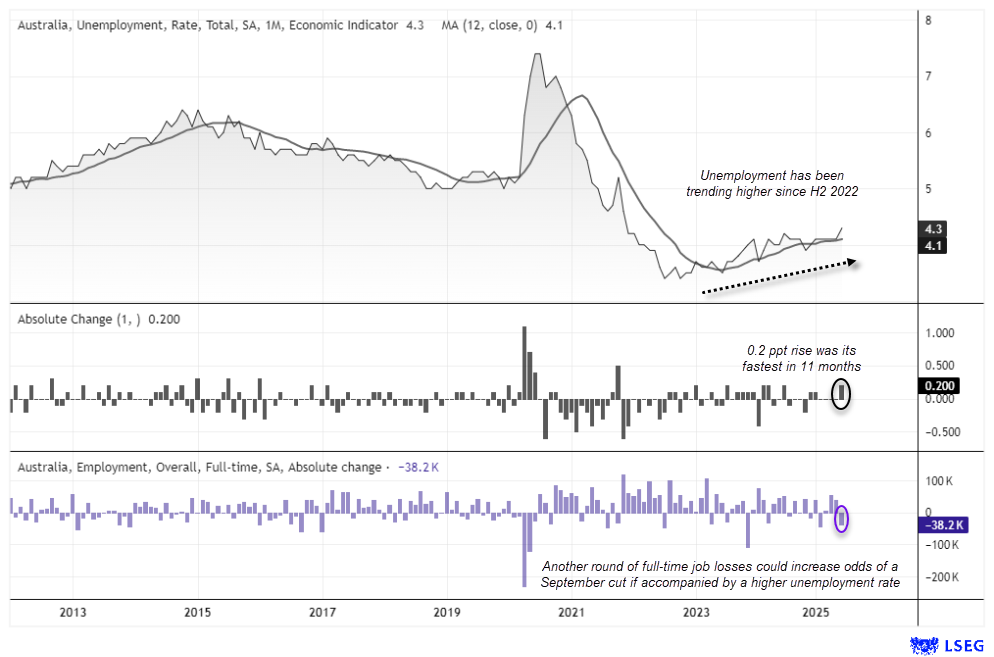
Chart prepared by Matt Simpson - data source: Australian Bureau of Statistics (ABS), London Stock Exchange Group (LSEG)
AUD/USD Technical Analysis: Australian Dollar vs US Dollar
The Australian dollar has climbed over 2% in the past eight days against the US dollar, even as traders continue to price in further RBA easing. While the Reserve Bank of Australia left the door open to three cuts by the end of 2026, policymakers signalled no urgency to act and retained flexibility to adjust policy if economic conditions shift.
From a technical perspective, AUD/USD has been grinding higher on the weekly chart. However, the 0.66 handle proved to be a key turning point in favour of the USD, with a bearish engulfing candle forming around the July VPOC (volume point of control). While the Australian dollar is tracking a second consecutive weekly gain, it has yet to reclaim the ground lost during that bearish engulfing week — keeping downside risks for AUD/USD in play.

AUD/USD Daily Technical Outlook
On the daily chart, AUD/USD formed an inverted hammer on Wednesday, with the upper wick stalling near the weekly R1 pivot at 0.6558 and the July VPOC at 0.6569. A bearish divergence has also emerged on the daily RSI (2), signalling that bullish momentum for the Australian dollar is starting to fade as the pair approaches the 0.66 handle.
This setup suggests at least a minor pullback in AUD/USD in the near term. Whether this retracement deepens will likely depend on the trajectory of the weakening US dollar. My bias is that the USD remains vulnerable, which could allow the Australian dollar to push AUD/USD to fresh highs once any short-term pullback plays out.
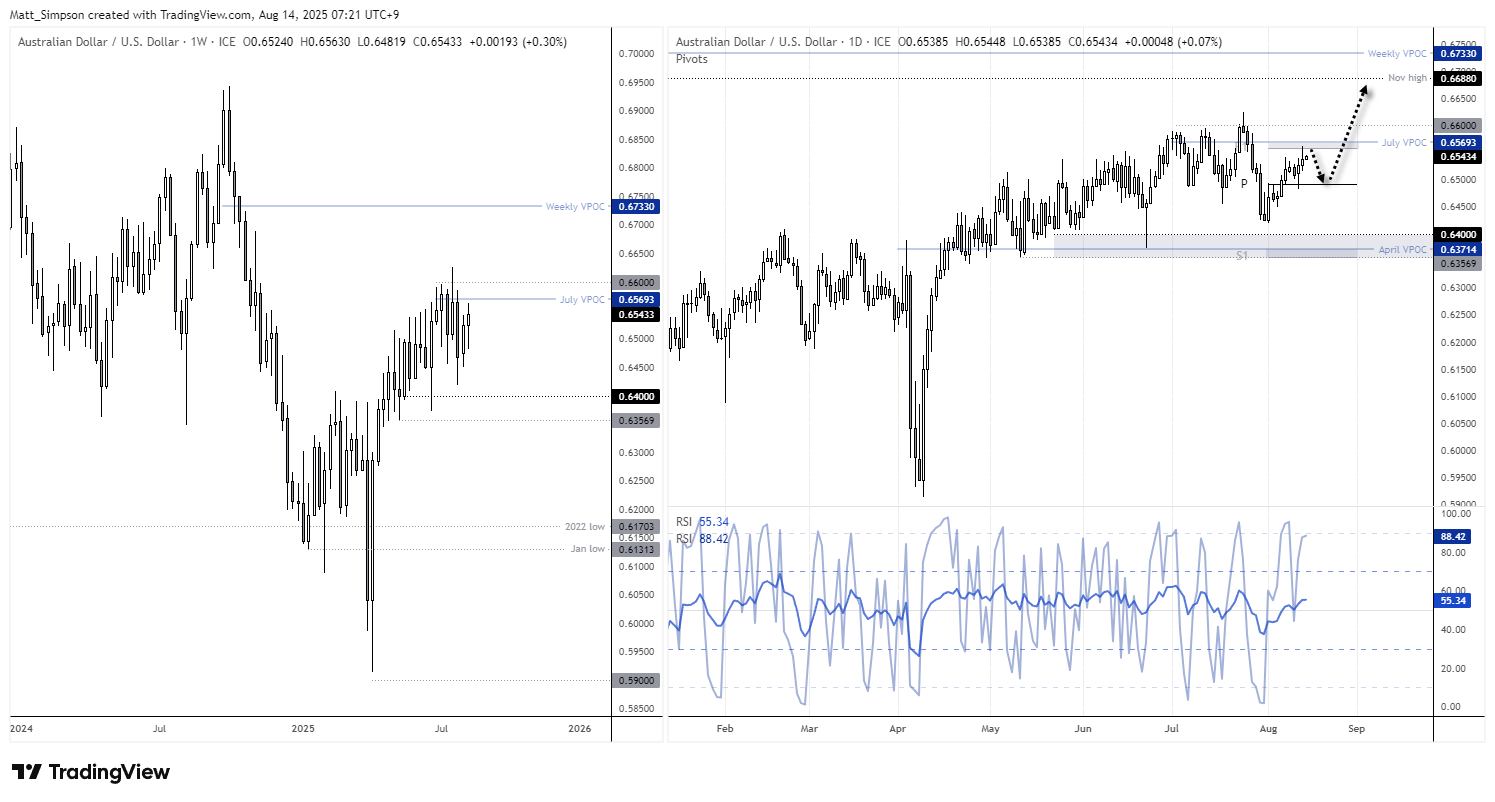
Chart analysis by Matt Simpson - data source: TradingView AUD/USD
![]()
Key Economic Events for Traders (AEST / GMT+10)
09:01 GBP RICS House Price Balance (GBP/USD, EUR/GBP, GBP/JPY)
11:30 AUD Employment Change, Full Employment Change, Participation Rate, Unemployment Rate (AUD/USD, AUD/JPY, AUD/NZD)
16:00 GBP Business Investment, Construction Output, GDP, Index of Services, Industrial Production, Manufacturing Production, Monthly GDP 3M/3M Change, Trade Balance, Trade Balance Non-EU (GBP/USD, EUR/GBP, FTSE 100)
16:30 CHF PPI (USD/CHF, EUR/CHF, CHF/JPY)
18:30 GBP Labour Productivity (GBP/USD, EUR/GBP, GBP/JPY)
19:00 EUR Employment Change, Employment Overall, GDP, Industrial Production (EUR/USD, EUR/GBP, DAX)
20:00 GBP Thomson Reuters IPSOS PCSI (GBP/USD, EUR/GBP, GBP/JPY)
20:00 EUR Germany Thomson Reuters IPSOS PCSI, Eurogroup Meetings (EUR/USD, EUR/GBP, DAX)
22:30 USD Continuing Jobless Claims, Core PPI, Initial Jobless Claims, PPI, PPI ex. Food/Energy/Transport (S&P 500, Nasdaq 100, USD/JPY)
00:30 USD Natural Gas Storage (WTI Crude, Brent Crude, USD/CAD)
01:30 USD 4-Week Bill Auction, 8-Week Bill Auction (S&P 500, Nasdaq 100, USD/JPY)
04:00 USD FOMC Member Barkin Speaks (S&P 500, Nasdaq 100, USD/JPY)
06:30 USD Fed's Balance Sheet (S&P 500, Nasdaq 100, USD/JPY)


