


Tariff headlines have returned to centre stage, with President Trump warning key trade partners that high tariffs will be implemented on 1 August if trade deals are not reached. His letters also threatened to increase tariffs should trade partners raise theirs on the US. While this provides just over three weeks to strike deals – which could turn out to be a good thing – it serves as a reminder that Trump means business, literally.
View related analysis:
- AUD/USD Weekly outlook: RBA Poised To Cut by 25bp
- AUD/USD H2 Outlook: Can the Australian Dollar Keep Rebounding?
- AUD/USD Outlook: RBA Rate Cut Likely as Inflation Hits 3.5-Year Low
Tariff Pressures Boost US Dollar as Wall Street Pulls Back
Wall Street indices faltered, with the S&P 500 and Nasdaq 100 falling around -0.9% from their record highs set on Friday. Dow Jones futures also fell -0.9%, forming a bearish engulfing day and gapping lower at today’s open alongside the S&P 500 and Nasdaq 100 futures markets.
The US dollar (USD) was the strongest of the major currencies, as the return of tariff threats revived fears of inflation and a constrained Federal Reserve (Fed) that may be unable to cut interest rates. The US dollar index rose for a fourth consecutive day, gaining 0.4% to reach a seven-day high.
Major FX Moves: USD Strengthens Across the Board Amid Tariff Tensions
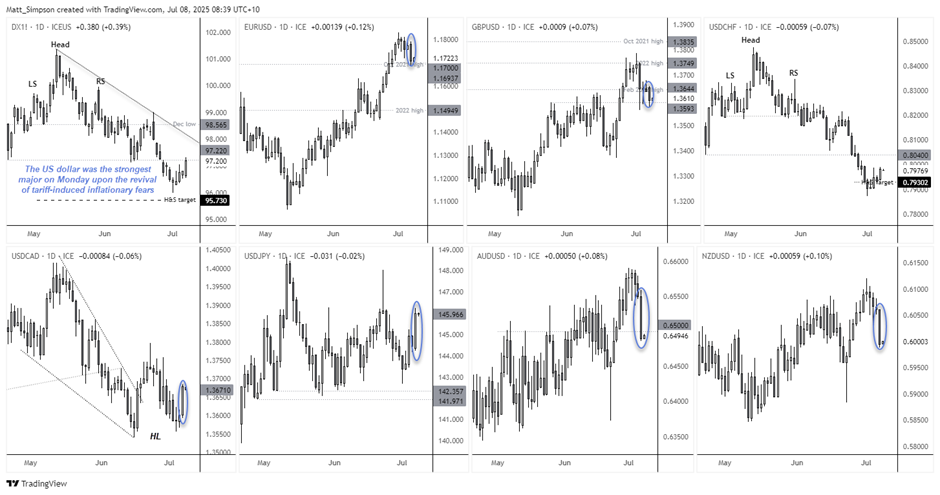
Chart analysis by Matt Simpson - data source: TradingView
- The Japanese yen (JPY) and New Zealand dollar (NZD) were the joint weakest major currencies, with USD/JPY rising 1.1% and NZD/USD falling by the same amount.
- Commodity currencies were broadly lower, with the Canadian dollar (CAD) and Australian dollar (AUD) also coming under pressure — sending USD/CAD up 0.6% and AUD/USD down 0.9%.
- The stronger US dollar and renewed tariff threats have allowed AUD/USD bears to refocus on potential RBA rate cuts, with the first expected today (read my preview for a full rundown).
- The euro (EUR/USD) fell 0.6% and formed a bearish engulfing candle. While support was found at the October high near 1.17, a break beneath this level would signal a deeper pullback for the euro — and further upside for the US dollar index.
- The British pound (GBP/USD) also printed a bearish engulfing day, keeping a move towards the June VPOC (1.3550) in play. A break beneath that level would bring the 2024 high at 1.3434 into focus.
- The Swiss franc (CHF) weakened alongside the yen, although safe-haven flows limited the damage. USD/CHF rose 0.5%, compared to the 0.9% gain seen on USD/JPY.

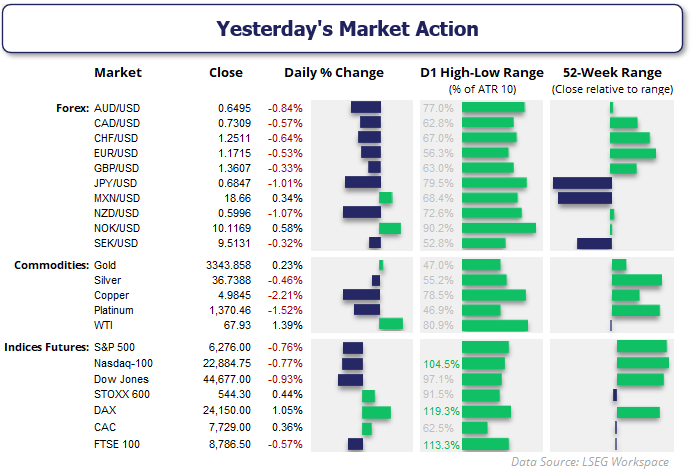
Chart prepared by Matt Simpson - data source: LSEG Workspace
US Dollar Index (DXY) Technical Analysis
The US dollar index is undergoing its most bearish decline since the pandemic, having fallen over 12% from the January high to last week’s low. But with prices holding above the 2023 low and Trump’s tariffs back in focus, a bullish case — even if only temporary — is starting to form for the US dollar.
The weekly DXY chart shows a small bullish pinbar that marked a false break beneath the 2023 low, suggesting an interim swing low may be in place. A bullish divergence has emerged on the RSI (2) after touching oversold territory in both April and May. A more subtle bullish divergence has also formed on the weekly RSI (14), hinting at waning bearish momentum.
I’m now on alert for a bounce toward the 10-week EMA (98.28) or the 99.00 handle near the bearish engulfing candle’s high. Should that bounce materialise, we can reassess the likelihood of a deeper recovery or whether the dominant bearish trend resumes.
A break below last week’s low would invalidate the short-term bullish case and open the door toward the high-volume node (HVN) around 91.74 — a move that assumes continued softening of US data and an increased likelihood of Fed rate cuts.
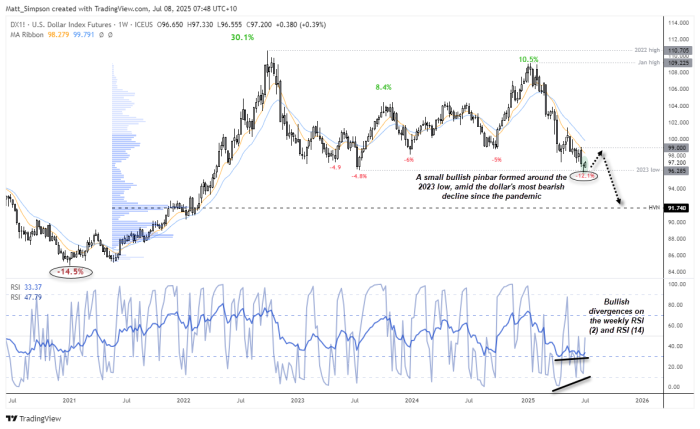
Chart analysis by Matt Simpson - data source: TradingView U.S. Dollar Index Futures

US Dollar Index (DXY) Daily Chart
The US dollar index came close enough to the downside head and shoulders (H&S) target at 95.73 to call it a success. Prices have now risen for four consecutive days, and the dollar could extend those gains if tariffs remain elevated for some US trade partners.
That said, the daily RSI (2) reached its most overbought level since 21 March on Monday, and prices closed on the April low. A bearish trendline also resides around the 98 handle, making it a potential resistance area for bulls to target or for bears to consider reloading around.
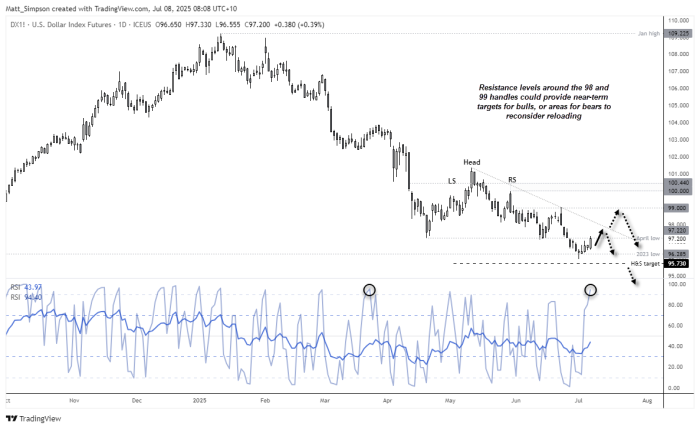
Chart analysis by Matt Simpson - data source: TradingView U.S. Dollar Index Futures
Economic Events in Focus (AEST / GMT+10)
09:50 JPY Adjusted Current Account (May), Bank Lending (YoY) (Jun), Current Account n.s.a. (May) (USD/JPY, Nikkei 225)
11:30 AUD NAB Business Confidence (Jun), NAB Business Survey (Jun) (AUD/USD, ASX 200)
14:30 AUD RBA Interest Rate Decision (Jul), RBA Rate Statement (AUD/USD, ASX 200)
15:00 JPY Economy Watchers Current Index (Jun) (USD/JPY, Nikkei 225)
16:00 EUR German Exports, Imports, Trade Balance (May), (EUR/USD, DAX)
19:30 EUR German 5-Year Bobl Auction (EUR/USD, DAX)
20:00 USD NFIB Small Business Optimism (Jun) (USD, S&P 500, Nasdaq 100, Dow Jones, Gold, Crude Oil)
00:00 CAD Ivey PMI (Jun) (USD/CAD, TSX)
00:00 EUR German Buba President Nagel Speaks (EUR/USD, DAX)
01:00 USD 1-Year Consumer Inflation Expectations (Jun) (USD, S&P 500, Nasdaq 100, Dow Jones, Gold, Crude Oil)
View the full economic calendar
-- Written by Matt Simpson
Follow Matt on Twitter @cLeverEdge
How to trade with City Index
You can trade with City Index by following these four easy steps:
- Open an account, or log in if you’re already a customer
• Open an account in the UK
• Open an account in Australia
• Open an account in Singapore
- Search for the market you want to trade in our award-winning platform
- Choose your position and size, and your stop and limit levels
- Place the trade


