
News that President Trump has nominated a less-dovish-than-expected successor for Jerome Powell helped the US dollar recover on Friday, leaving a prominent bullish reversal candle at support. That rebound could leave the dollar vulnerable to further upside if incoming data surprise positively. Given the strength in ISM manufacturing, that momentum could feed through to firmer ISM services and nonfarm payrolls figures.
View related analysis:
- So how good is APD at predicting NFP, anyway?
- Nasdaq 100 Outlook: Earnings Strength Meets Technical Resistance
- FX Futures Positioning: USD Index, AUD/USD, USD/CAD | COT report
- The US Dollar’s Demise Could Just Be Getting Started
- US Dollar Rebound Appears Corrective, EUR/USD And GBPUSD Set To Bounce?
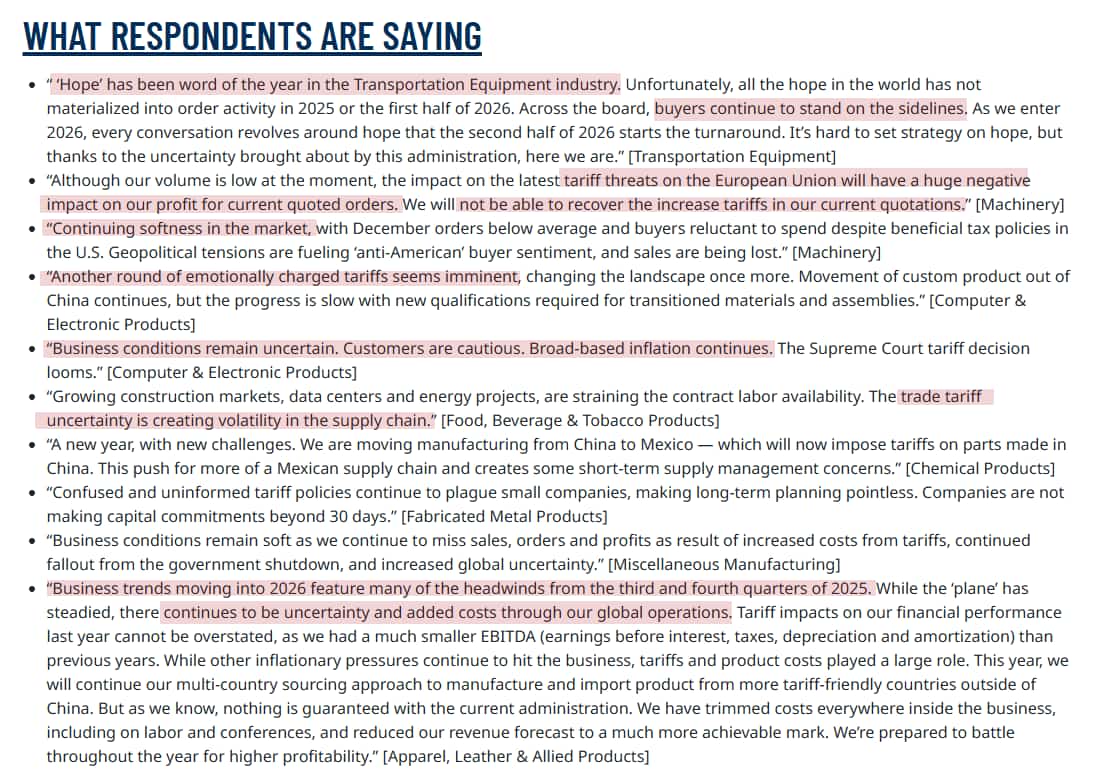
That said, it’s not all about the headline data. Respondent comments in the ISM manufacturing survey diverge sharply from the upbeat headline figures, and while the US economy continues to add jobs, the headline number is increasingly being propped up by a single segment of the private sector. We may simply be seeing an upswing in fragile data, which could keep the broader bearish US dollar outlook alive once the current bounce runs its course.
ISM Manufacturing PMI Jumps, but Confidence Lags
A glance at the ISM manufacturing PMI suggests it packed a punch — but that optimism isn’t backed up by respondent comments.
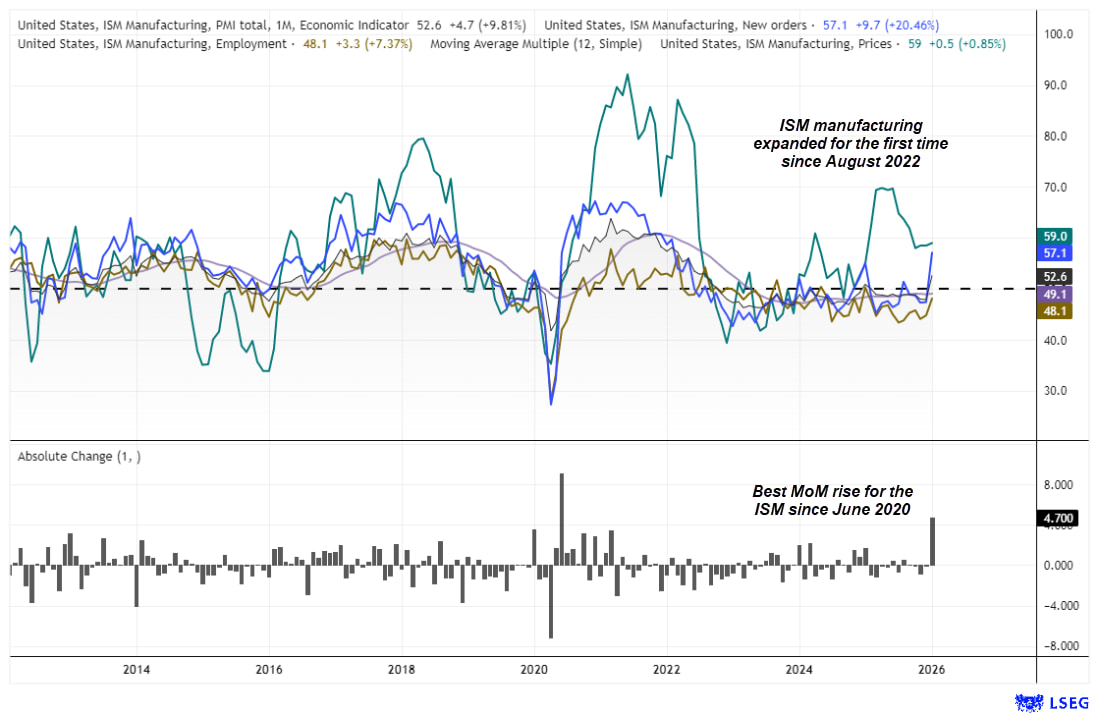
Source: ISM, LSEG
- Manufacturing expanded for the first time since August 2022
- The 4.7-point m/m rise was the fastest since June 2020
- New orders moved back into expansion
- Employment continued to contract, albeit at a slower pace
- Prices paid were effectively flat, though still elevated
However, the underlying comments remain cautious and, in many cases, outright negative. That raises the risk that January’s PMI surge was more blip than trend.
The services PMI is due tomorrow and is arguably the more important read. For now, the manufacturing backdrop looks less encouraging than the headline figures imply.
Source: ISM
Services PMI in Focus as Rate-Cut Hopes Hang in the Balance
The 12-month average of the ISM services PMI sits at 51.7, but the index itself has strengthened in recent months and last stood at 53.8. The employment index rose to a 10-month high of 51.7, new orders expanded at their fastest pace in 14 months, and business activity reached a nine-month high. Meanwhile, the prices paid index has eased from its three-year high but remains elevated at 65.1, signalling that inflationary pressures are still lingering. That resilience supports growth expectations — and is clearly not what Fed doves want to hear.
There is a reasonable chance of another robust services report this week, which would likely keep rate-cut expectations firmly in the unlikely pile for the foreseeable future. Attention, however, will quickly shift to Friday’s nonfarm payrolls report.

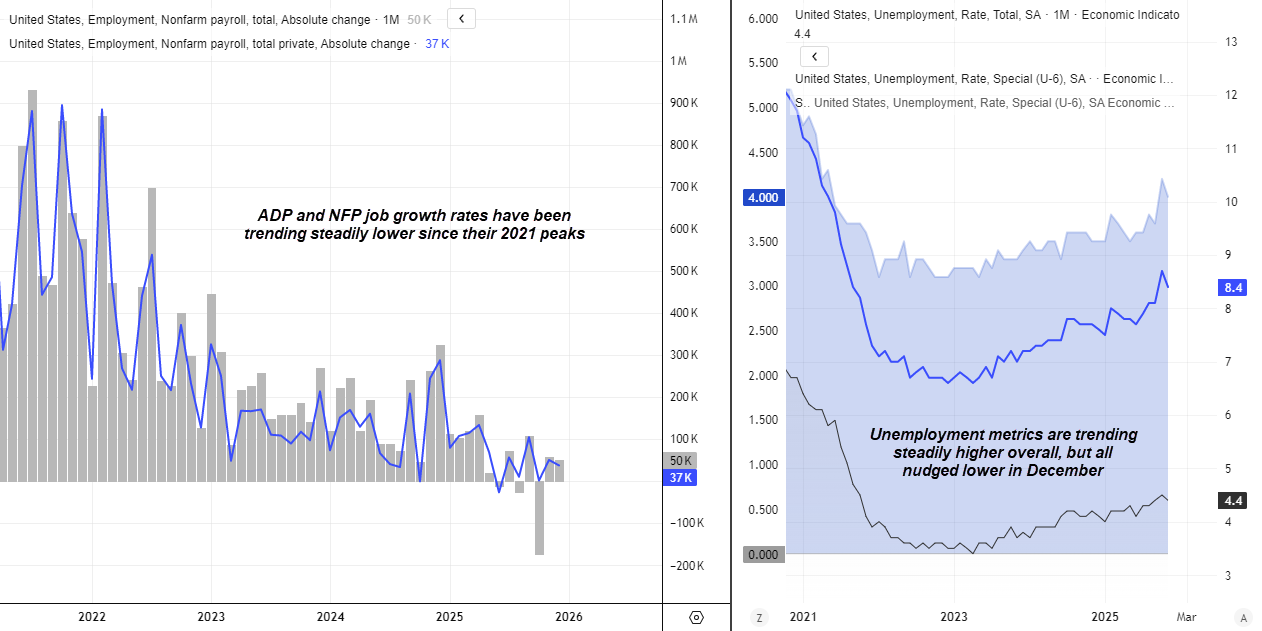
ADP Employment Data Sets the Tone Ahead of ISM Services and NFP
ADP employment figures are released ahead of the ISM services report. While ADP is not particularly good at predicting the absolute level or monthly change in nonfarm payrolls, it does tend to move in the same direction as the headline jobs figure. As such, a surprise upside print alongside a solid ISM services report could generate some bullish momentum for US dollar bulls heading into Friday’s nonfarm payrolls report.
Source: BLS
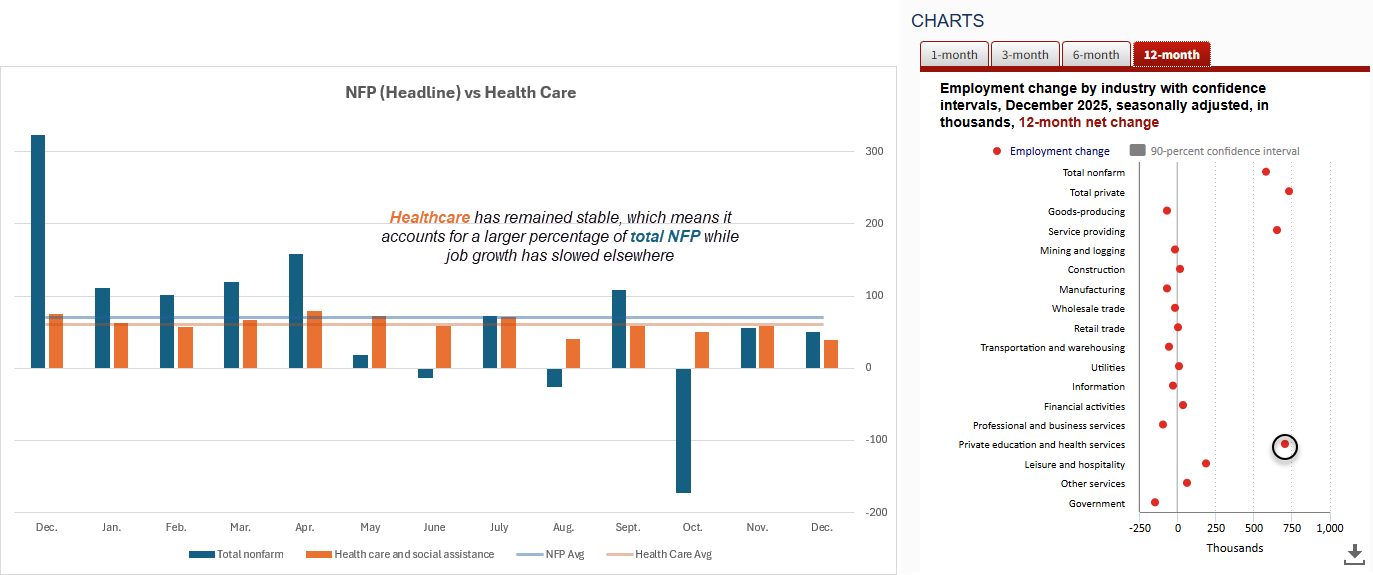
Healthcare Hiring in Focus as Broader Job Growth Slows
Healthcare is a key sector to watch in the nonfarm payrolls report, given its outsized contribution to recent headline job gains. Last month’s 38.5k increase in healthcare and social assistance accounted for 77% of net jobs added in December, or 66.4% of the private-sector services total.
While healthcare has not always carried such weight, its importance has grown as overall employment gains have slowed, while hiring in the sector has remained relatively stable. That said, December’s 38.5k print was well below its own 13-month average of 60.6k. A further deterioration here could spell broader trouble for overall job growth.
Source: BLS, LSEG

US Dollar Index (DXY) Technical Analysis
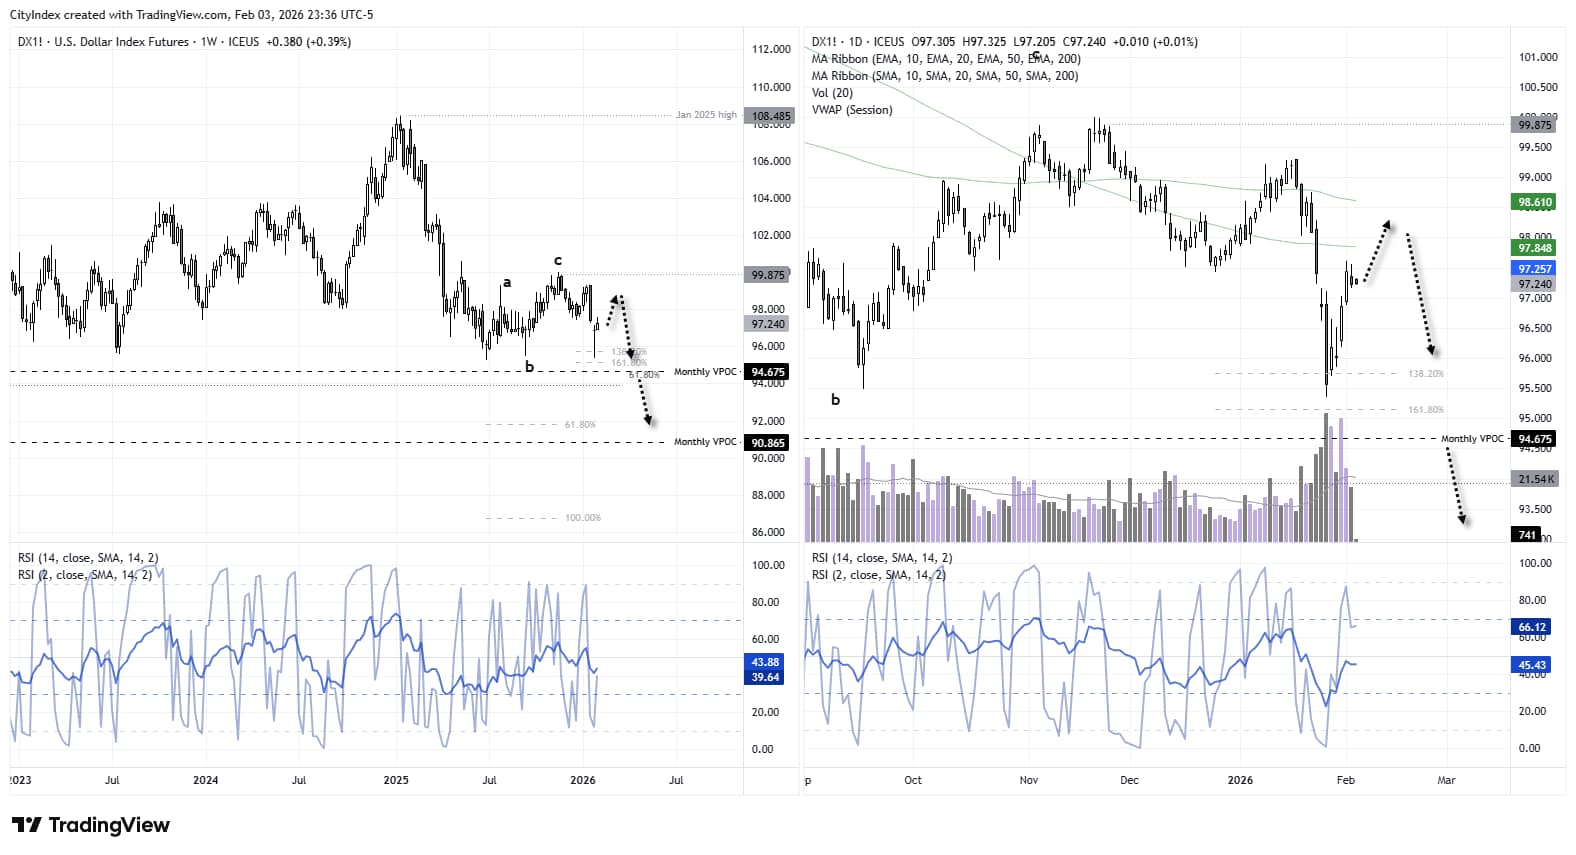
My core bearish bias remains intact on the weekly chart, based on the assumption that the January 2025 high marked a lower high relative to the major peak in 2022. An ABC corrective structure is also assumed to have completed in November, with the bearish case remaining valid while prices stay below 99.87 and an eventual break beneath 95 in line with the downtrend from the January 2025 high.
That said, near-term upside risks are apparent. A bullish pin bar formed last week around the July and September cycle lows. On the daily chart, trading volumes were elevated during the recent upswing, suggesting a combination of short covering and fresh bullish initiation. While a small bearish inside day formed on Tuesday, bulls may look to buy dips towards 96.50 in anticipation of a push towards 98 or 98.50.
Beyond any near-term bounce, I will continue to look for evidence of a daily swing high in anticipation of the next major leg lower for the US dollar.
Source: ICE, TradingView
View the full economic calendar
-- Written by Matt Simpson
Follow Matt on Twitter @cLeverEdge
How to trade with City Index
You can trade with City Index by following these four easy steps:
- Open an account, or log in if you’re already a customer
• Open an account in the UK
• Open an account in Australia
• Open an account in Singapore
- Search for the market you want to trade in our award-winning platform
- Choose your position and size, and your stop and limit levels
- Place the trade