


The US dollar reversed higher after the Federal Reserve delivered a 25bp cut, resisted calls for a 50bp move, and confirmed two more cuts by year-end. Markets had positioned for a more dovish outcome, which saw the greenback strengthen as traders reassessed the Fed’s stance.
Across FX majors, reversal candles and false breaks of support and resistance highlight a corrective rebound for the US dollar. This could lead to choppy near-term trading conditions and countertrend moves across pairs such as AUD/USD and GBP/AUD, with Australia’s employment data and UK CPI in sharp focus.
View related analysis:
- EUR/GBP Outlook: Euro Favoured as Dollar Declines, British Pound Lags
- British Pound Price Action Setups: GBP/USD, GBP/JPY, GBP/CAD, GBP/AUD
- Australian Dollar Outlook: AUD/USD Firm Ahead of FOMC
- EUR/USD, USD/JPY, VIX, Gold, Crude oil: COT Report Analysis
US Dollar Correction: AUD/USD and GBP/AUD Traders Await Jobs and CPI Data
The Fed meeting went pretty much as I expected: They delivered the 25bp cut, pushed back on a 50bp cut and confirmed two more rate cuts are to arrive by December. The fact that the US dollar traded higher after the FOMC meeting suggests traders were indeed positioned for either a 50bp cut or more dovish 25bp cut. But I always felt the odds of the Fed hitting the panic button was slim, as it would have looked like they had bowed to Trump’s pressure while also admitting they were behind their own curve.
Ultimately, the US dollar may be able to retrace higher against recent losses in the near term. Looking across FX majors, most have either printed reversal candles or reversed after false breaks of their respective support or resistance levels – both in favour of US dollar strength. To me, this suggests we’ve now entered a corrective phase higher for the US dollar, which could bring choppy trading conditions and countertrend moves across the FX space in the short term.
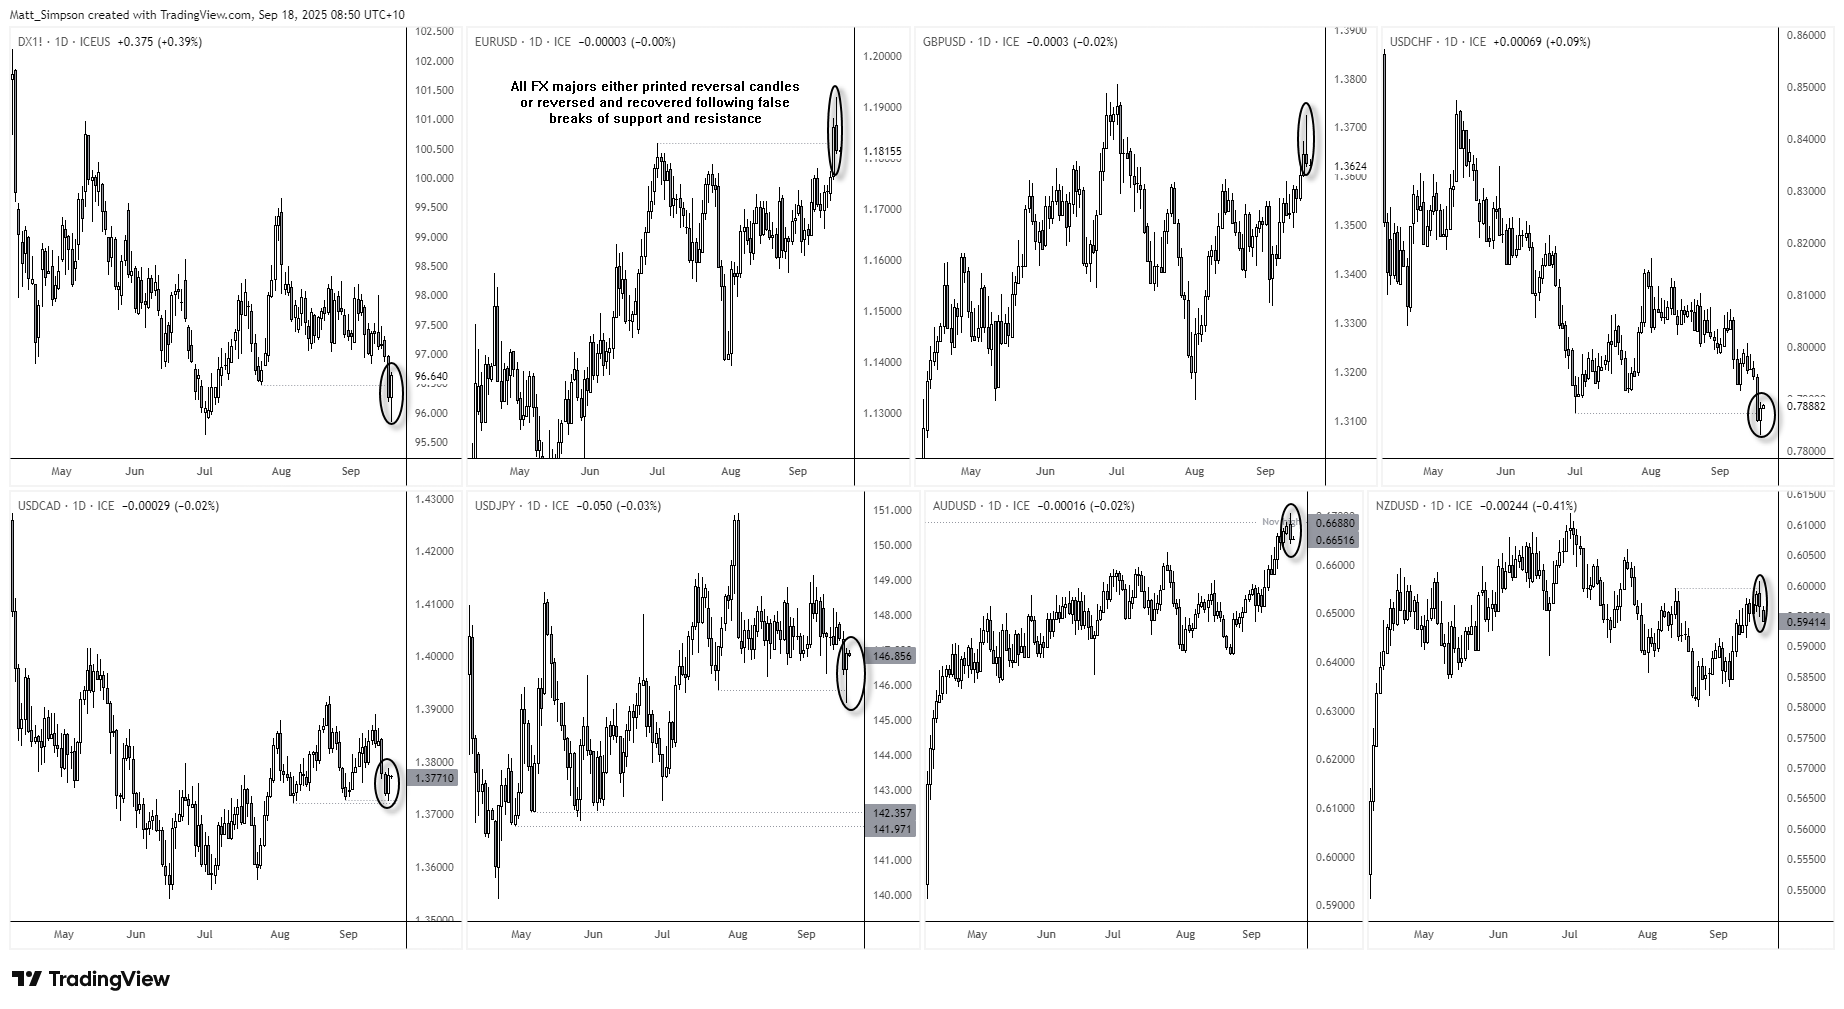
Chart analysis by Matt Simpson - data source: TradingView
AUD/USD Technical Analysis: Australian Dollar vs US Dollar
Overnight implied volatility for the Australian dollar rose 2.9 percentage points to 6.455. However, with 1-week implied volatility slipping 0.7 ppt to 6.610 – and remaining slightly above the 1-day level – the uptick in volatility may prove short-lived.
Technically, AUD/USD posted a bearish engulfing day on Wednesday, signalling a potential short-term top and the risk of a pullback. The pair also closed back beneath its November high and both the 200-day simple and exponential moving averages. A minor bearish divergence has also emerged on the daily RSI (2) within overbought territory, reinforcing downside risks for the Australian dollar against the US dollar.

Chart analysis by Matt Simpson - data source: TradingView AUD/USD
AUD/USD Technical Analysis: Daily and 1-Hour Chart
The 1-hour chart highlights a sharp spike in volume around the Fed’s rate decision and Jerome Powell’s speech. That single 65-pip (1%) candle accounted for the entire day’s range. AUD/USD ultimately closed lower while the US dollar strengthened, showing the meeting was less dovish than markets had anticipated.
On the 1-hour chart, a potential double bottom has formed at 0.6640, just above a high-volume node (HVN). This suggests a minor bounce could unfold, particularly if Australia’s upcoming employment report shows resilience. However, the elongated high-volume bearish outside bar points to downside risk, with sellers likely to fade into rallies. A move towards the weekly VPOC and HVN near 0.6600 remains possible, and a break beneath that zone would expose the 0.6580 support area.

Chart analysis by Matt Simpson - data source: TradingView AUD/USD
GBP/AUD Technical Analysis: British Pound vs Australian Dollar
With both the Australian employment report and UK inflation data released today, GBP/AUD could draw increased attention from traders. The Bank of England now appears unlikely to cut rates again this year, but a softer Australian jobs print ahead of the UK CPI release could pressure the Aussie. If UK inflation data keeps the BoE on hold, the British pound may extend its countertrend bounce against the Australian dollar.
GBP/AUD has fallen more than 3% since the August peak in a near-straight decline. However, a bullish divergence on the daily RSI (2) has emerged near the cycle low, and momentum is turning higher after a pair of small doji candles printed around the monthly S1 pivot.
Initial resistance sits at the high-volume node (HVN) near 2.0531, but a break above it would open the way towards the monthly pivot point at 2.0699.

Chart analysis by Matt Simpson - data source: TradingView GBP/AUD
Economic Events in Focus (AEST / GMT+10)
14:00 GBP Car Registration (Jul) (FTSE 100, GBP/USD)
14:00 EUR German Car Registration (Jul) (DAX, EUR/USD, EUR/GBP)
17:00 CHF GDP (Q2) (USD/CHF, EUR/CHF)
18:00 EUR M3 Money Supply (Jul), Loans to Non Financial Corporations (Jul), Private Sector Loans (Jul) (EUR/USD, EUR/GBP, DAX)
18:30 EUR Portuguese Business Confidence (Aug), Portuguese Consumer Confidence (Aug) (EUR/USD, EUR/GBP)
19:00 EUR Business and Consumer Survey (Aug), Business Climate (Aug), Consumer Confidence (Aug), Consumer Inflation Expectation (Aug), Selling Price Expectations (Aug), Services Sentiment (Aug), Industrial Sentiment (Aug) (EUR/USD, EUR/GBP, DAX)
21:30 EUR ECB Publishes Account of Monetary Policy Meeting (EUR/USD, EUR/GBP, DAX)
22:30 USD Continuing Jobless Claims, Core PCE Prices (Q2), Corporate Profits (Q2), GDP (Q2), GDP Price Index (Q2), GDP Sales (Q2), Initial Jobless Claims, Jobless Claims 4-Week Avg., PCE Prices (Q2), Real Consumer Spending (Q2) (S&P 500, Nasdaq 100, USD/JPY)
22:30 CAD Average Weekly Earnings (Jun), Current Account (Q2) (USD/CAD, CAD/JPY)
00:00 USD Pending Home Sales (Jul), Pending Home Sales Index (Jul) (S&P 500, Nasdaq 100, USD/JPY)
00:30 USD Natural Gas Storage (WTI Crude, Brent Crude, USD/CAD)
01:00 USD KC Fed Composite Index (Aug), KC Fed Manufacturing Index (Aug) (S&P 500, Nasdaq 100, USD/JPY)


