


The US dollar came under broad selling pressure on Monday after President Trump threatened tariffs on any country blocking his move to take Greenland. The rhetoric has effectively reignited trade-war risks, raising the prospect of retaliation — particularly from European countries — even if no formal response has yet emerged.
Dollar weakness suggests markets view Trump’s actions as reckless, inflationary and globally destabilising rather than pro-growth. And with US markets closed for a public holiday, it could also be argued that the initial reaction was understated.
View related analysis:
- USD/JPY, EUR/USD, USD/CHF: FX Futures Positioning | COT Report
- Australian Dollar Outlook: AUD/USD Stuck as Geopolitics and US Data Loom
- Apple (AAPL) Q4 Earnings Preview: Services in Focus as iPhone Growth Slows
- Tesla (TSLA) Earnings Preview: Q4 Margins in Focus
Source: Tradingview, ICE
US Dollar Weakens as Trump Tariff Risks Return
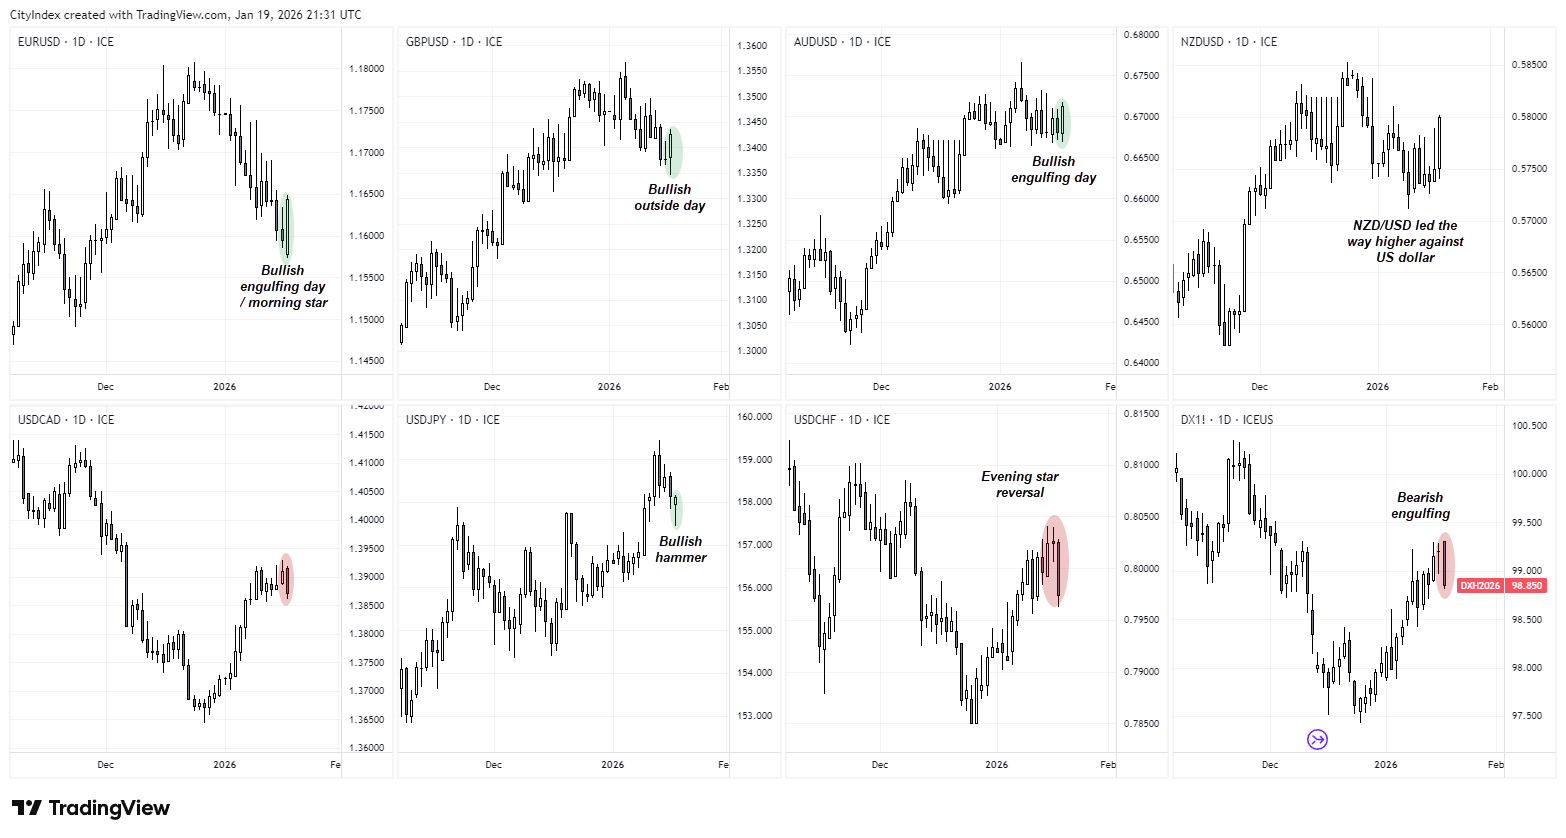
- The US dollar was the joint-weakest currency alongside the Japanese yen on Monday, with USD/JPY effectively flat by the close — though it did print a small bullish hammer on the daily chart.
- The New Zealand dollar was the strongest FX major, with NZD/USD rising 0.8% after a run of positive data reinforced the view that the RBNZ has ended its easing cycle and teased the odds of a first hike.
- The Swiss franc also made solid gains, with USD/CHF down 0.6% and back below 0.80, marking its most bearish day in 28 days.
- The Australian dollar continued to hold above recent range lows, with AUD/USD closing above 67c and forming a bullish engulfing day.
- EUR/USD rose 0.4% and printed a prominent bullish engulfing day, its best performance in 20 days.
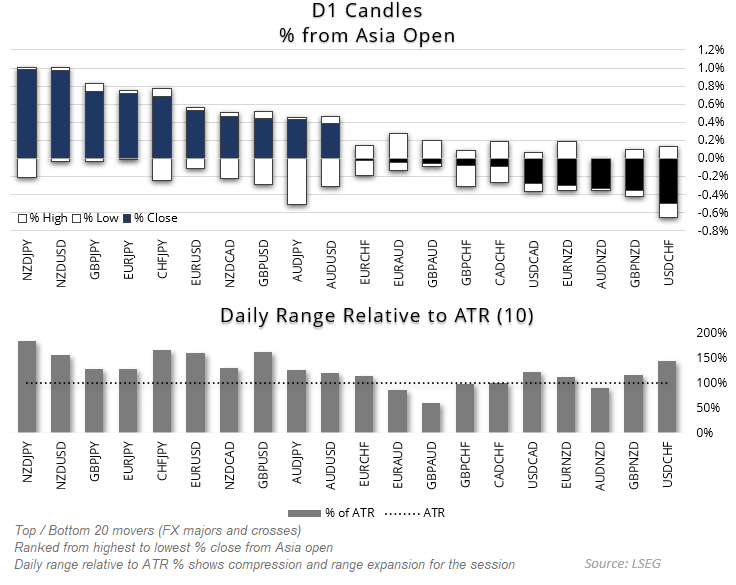
- Across FX majors and crosses, 16 of the top 20 movers recorded daily ranges above their 10-day average — notable given the US public holiday.
Source: LSEG

EUR/USD Technical Analysis: Euro vs US Dollar
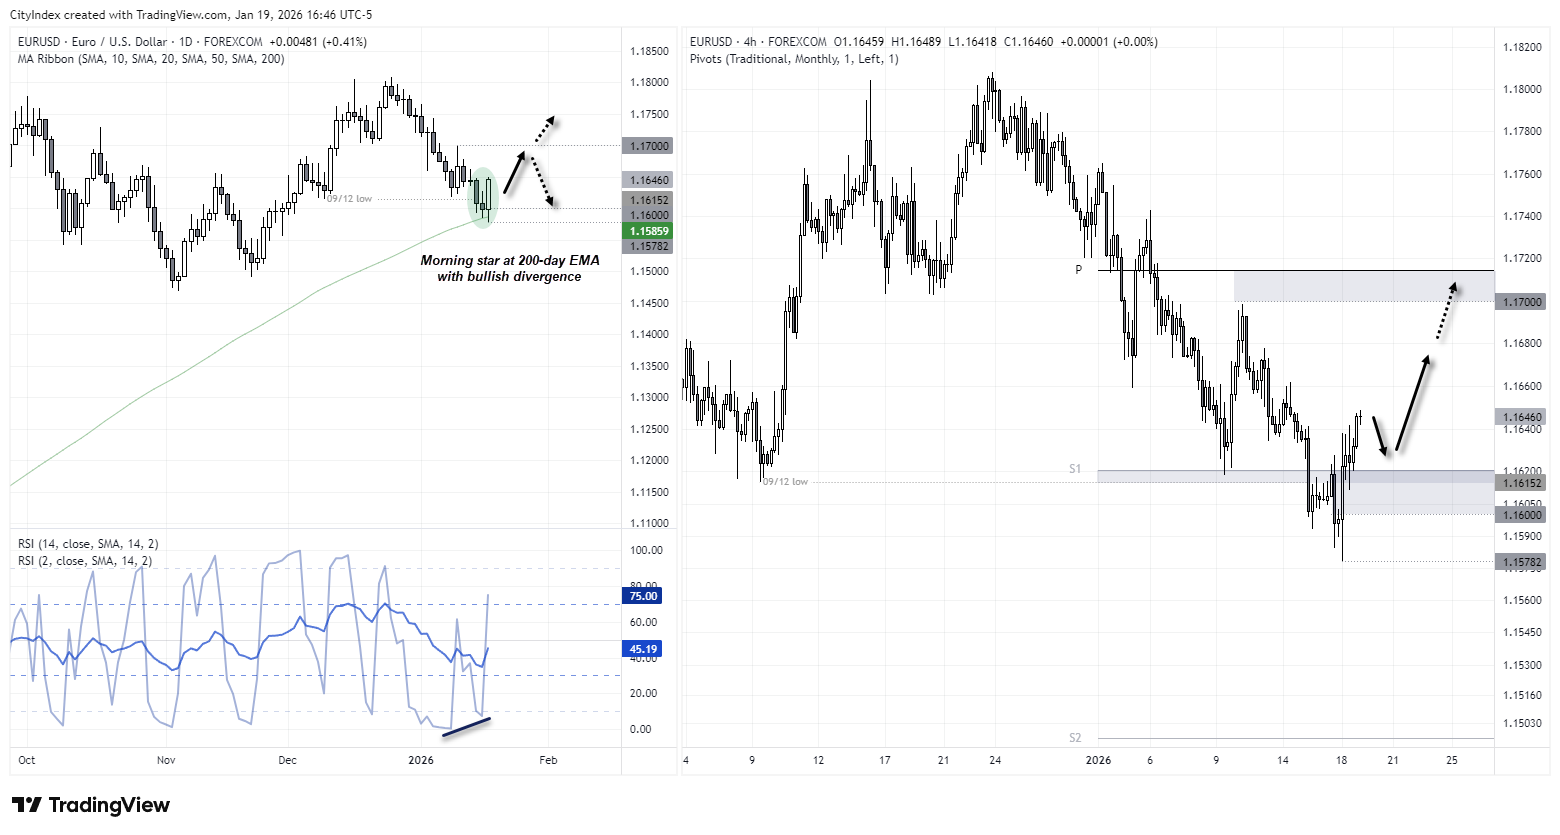
The 200-day average came to the rescue for EUR/USD on Monday, with the pair printing a prominent bullish engulfing day at a key support level. This also leaves a three-bar bullish reversal (morning star) in play, which coincided with bullish divergence on the daily RSI (2).
The 4-hour chart shows EUR/USD also produced a false break of the December 9 low ahead of Monday’s bullish reversal. That bear trap adds further weight to the reversal signal.
Bulls could seek dips towards the monthly S1 pivot (1.1620) or the 1.16 handle in anticipation of the euro’s next leg higher. Resistance comes in at 1.1680, the 1.17 handle, and the monthly pivot point at 1.1715.
Source: TradingView

USD/JPY Technical Analysis: US Dollar vs Japanese Yen
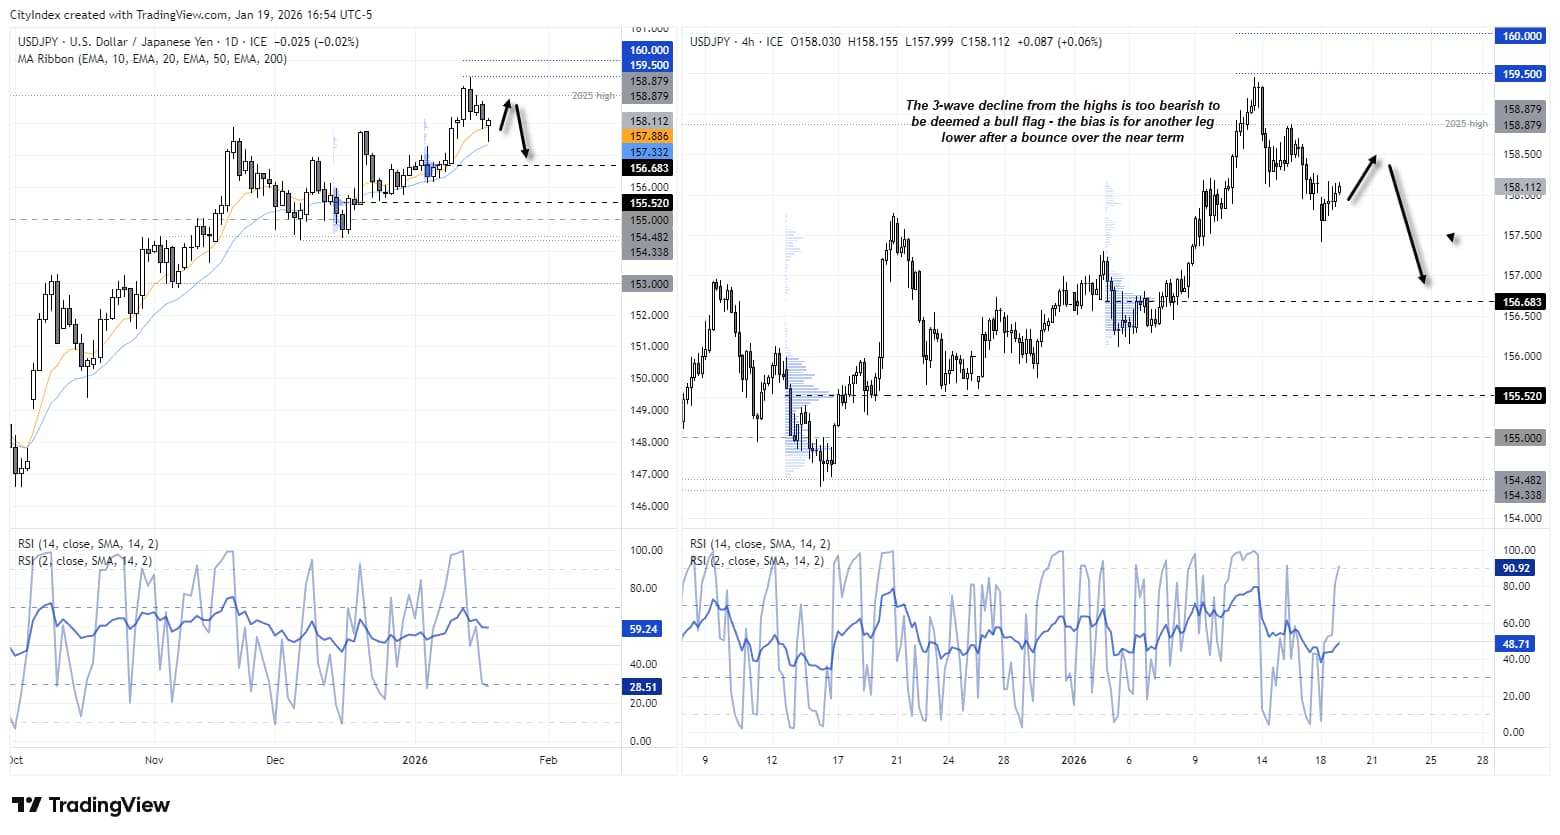
The daily chart shows USD/JPY formed a small bullish hammer on Monday, respecting the 20-day EMA. While this hints at a near-term bounce, upside potential looks limited. The daily RSI (2) is not yet oversold, while RSI (14) continues to track lower, suggesting momentum remains fragile.
The 4-hour chart shows a three-wave corrective decline, and its structure does not resemble a bull flag in my view, with momentum remaining too bearish overall. As such, while USD/JPY may enjoy a brief bounce near term, my bias remains for a move towards 157 or the 156.68 high-volume node (HVN) once any corrective rebound is out of the way.
Source: TradingView
View the full economic calendar
-- Written by Matt Simpson
Follow Matt on Twitter @cLeverEdge
How to trade with City Index
You can trade with City Index by following these four easy steps:
- Open an account, or log in if you’re already a customer
• Open an account in the UK
• Open an account in Australia
• Open an account in Singapore
- Search for the market you want to trade in our award-winning platform
- Choose your position and size, and your stop and limit levels
- Place the trade


