
- USD bid despite lower US yields and energy
- AUD/USD drifting lower with 0.6943 under pressure
- RBA May hike pricing eases after soft inflation report
Summary
AUD/USD is being dragged lower by a USD surge that isn’t being driven by yields or energy, while softer Australian inflation is starting to erode hawkish RBA support that had underpinned the pair.
With 0.6943 continuing to absorb dips but now coming under renewed pressure, traders need to understand what’s changed and how to position if that floor finally gives way.
US dollar behaviour shifts
The US dollar did something strange on Wednesday, rallying hard despite lower energy prices and Treasury yields, upending the playbook that had been seen since the Iran war began.
Up until now, the relationship has been obvious. Higher energy prices have pushed Treasury yields higher, lifting the dollar alongside as markets priced a stronger inflation impulse and even a small chance of further Fed tightening. When energy has pulled back, yields and the dollar have typically followed.
That didn’t happen yesterday.
Energy softened through most of the session, Treasury yields moved lower, led by the longer end, yet the dollar remained firmly bid from Asia through to North America.
The breakdown is clear in the correlation matrix below, with the positive relationship between the dollar, energy and yields weakening sharply over the past week, as indicated by the negative figures in brackets tracking change over the period.
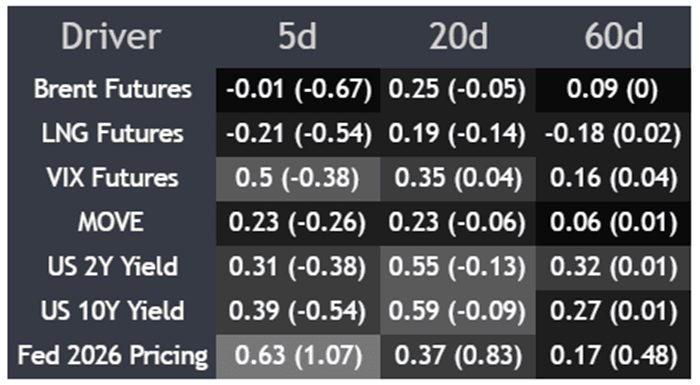
Source: TradingView
If this was about Fed pricing, you’d expect the two-year to be doing the heavy lifting. But the dollar hasn’t shown much interest in that part of the curve, making it hard to argue this is a clean rates-driven move.
It suggests a new driver may be emerging. With only a handful of trading days left in March, quarter-end flows may be starting to assert themselves, resulting in a scramble for US dollars. If so, it is something traders need to consider when assessing setups, along with price signals generated during this period.
Softer inflation dents RBA outlook
AUD/USD was among the hardest hit, with yesterday’s softer February inflation report likely contributing at the margin, something we’ll run through next.
Both headline and core inflation came in a touch softer than expected in February, with CPI holding at 3.7% and the trimmed mean at 3.3% from a year earlier, both undershooting forecasts by a tenth. The miss was driven by softer housing costs, with new dwelling prices rising just 0.1% in the month, alongside weakness across household goods and parts of the services sector.
While it’s already dated given the lift in energy prices so far in March, it does take a bit of pressure off the RBA to keep hiking, adding to the sense that momentum in the economy may have already been cooling before the conflict, something also hinted at in recent spending and labour market data.
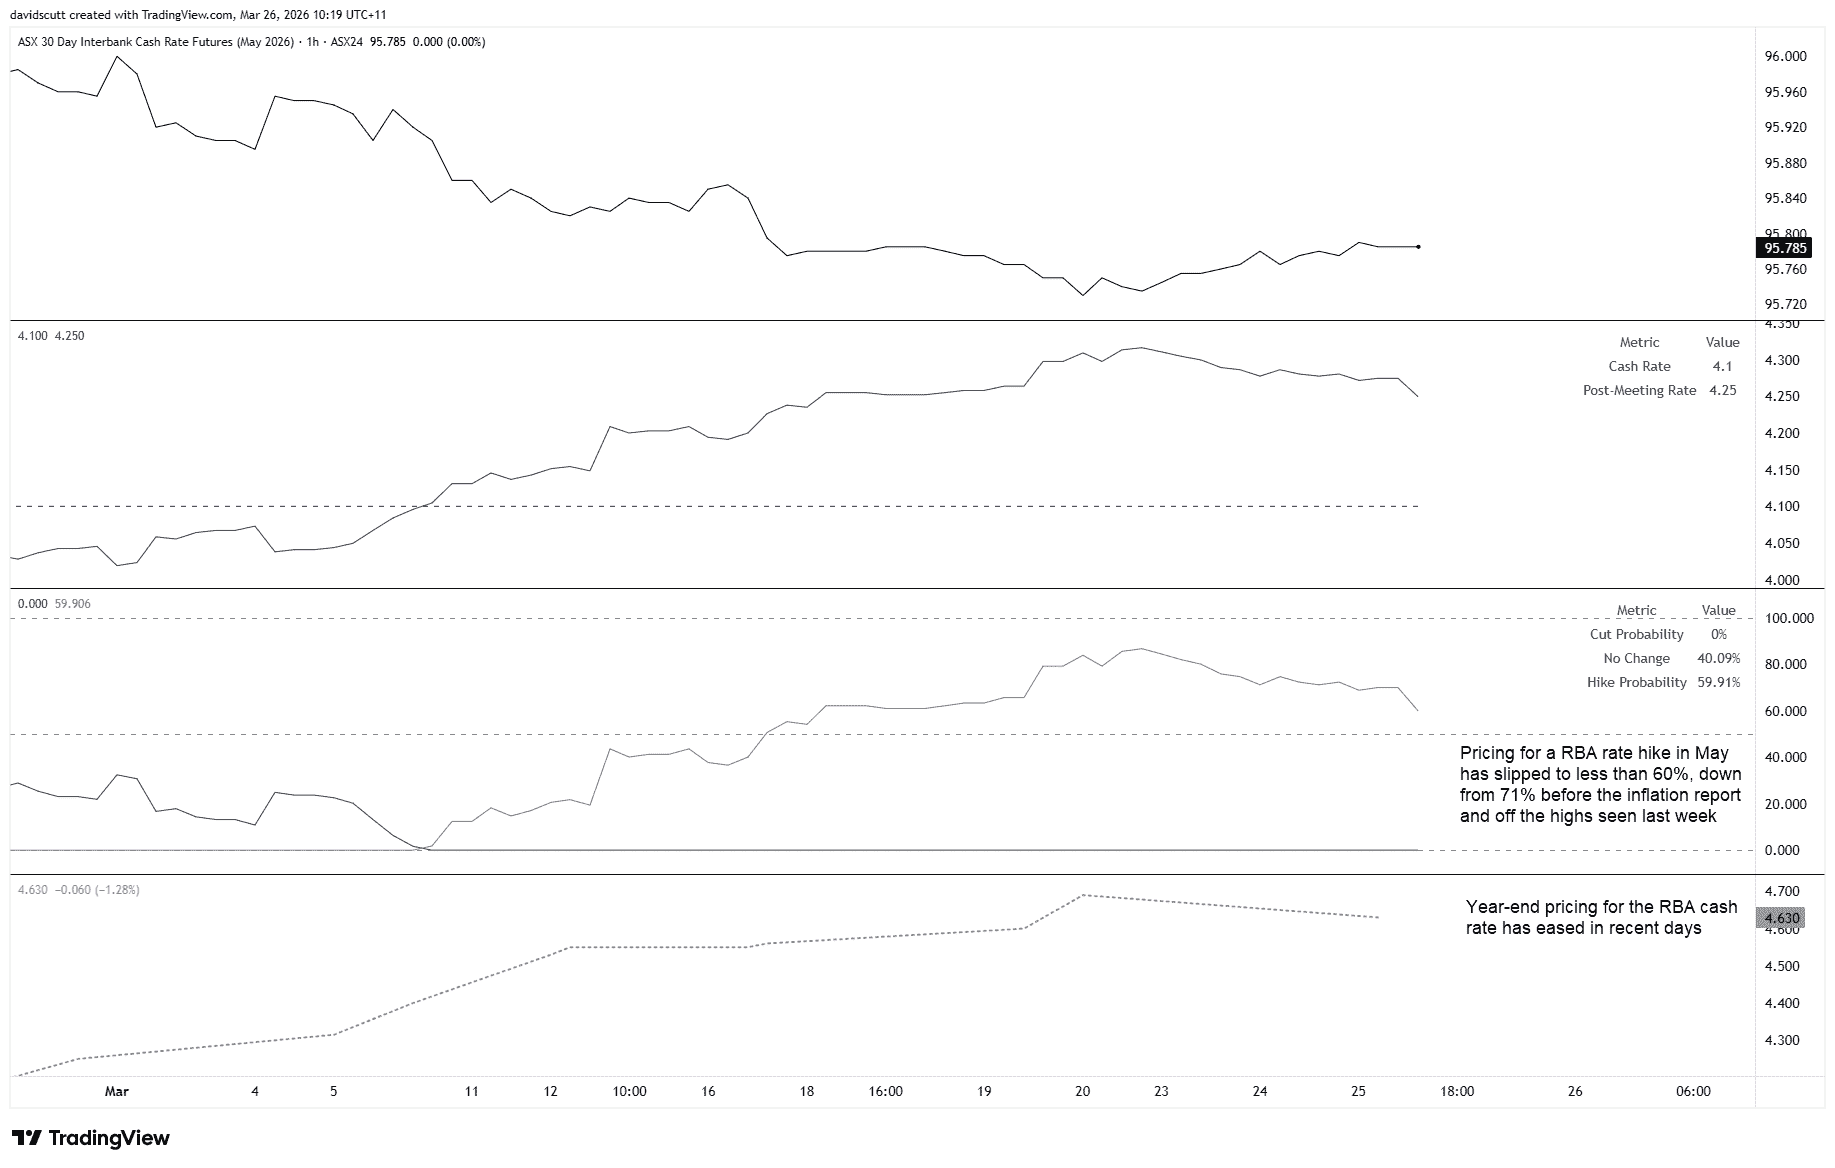
Source: TradingView
You can see that reflected in rates pricing, with expectations for a May RBA hike easing back. Prior to the release, markets were pricing around a seventy-one percent chance of a move, now it’s slipped to below sixty percent, while year-end pricing for the cash rate has edged lower to around 4.63%.
Source: TradingView
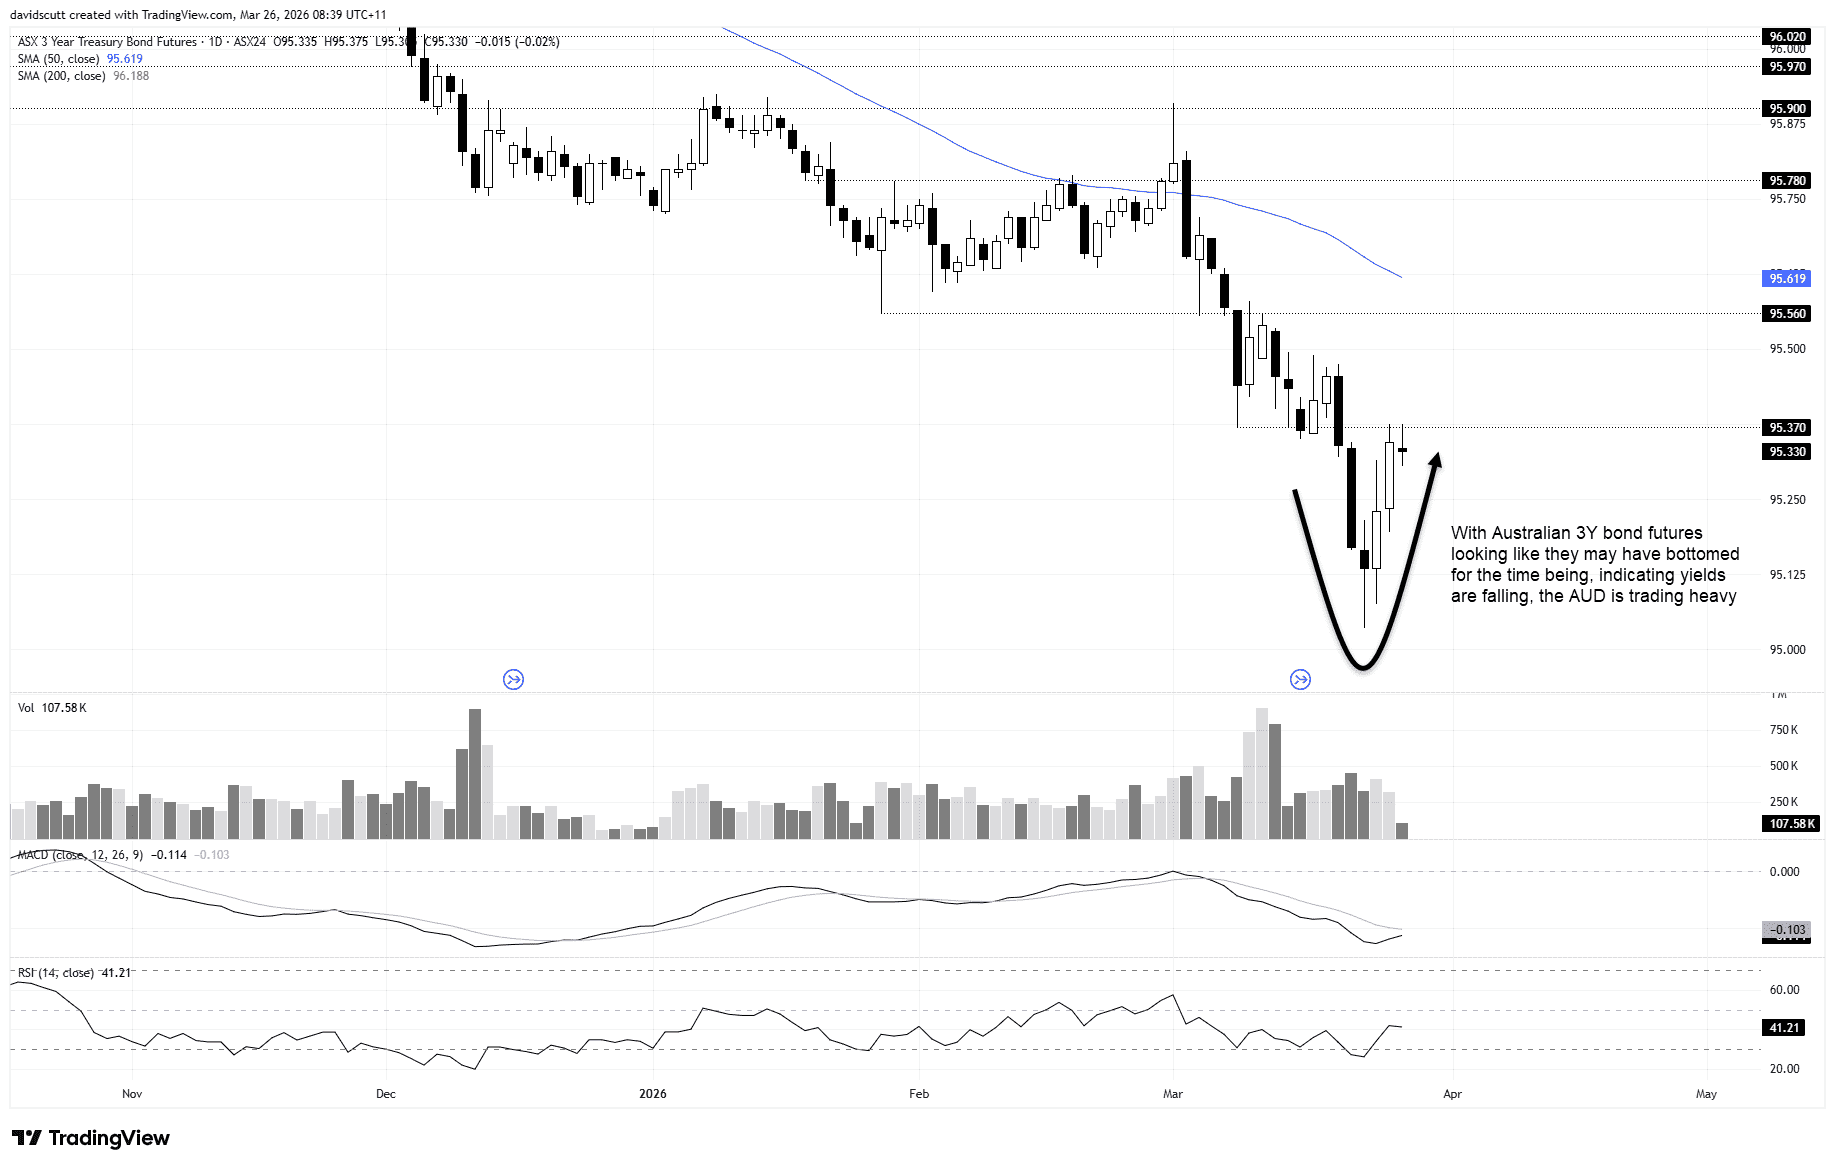
Australian three-year government bond futures also pushed higher during the session, indicating lower yields, before running into resistance near 95.37, helped in part by similar moves in global rates.
Taken together, it suggests the support the Aussie had been receiving from the RBA being viewed as the most hawkish G10 central bank prior to the war may have peaked, something traders need to consider not just against the USD, but across the crosses.
AUD/USD trading heavy
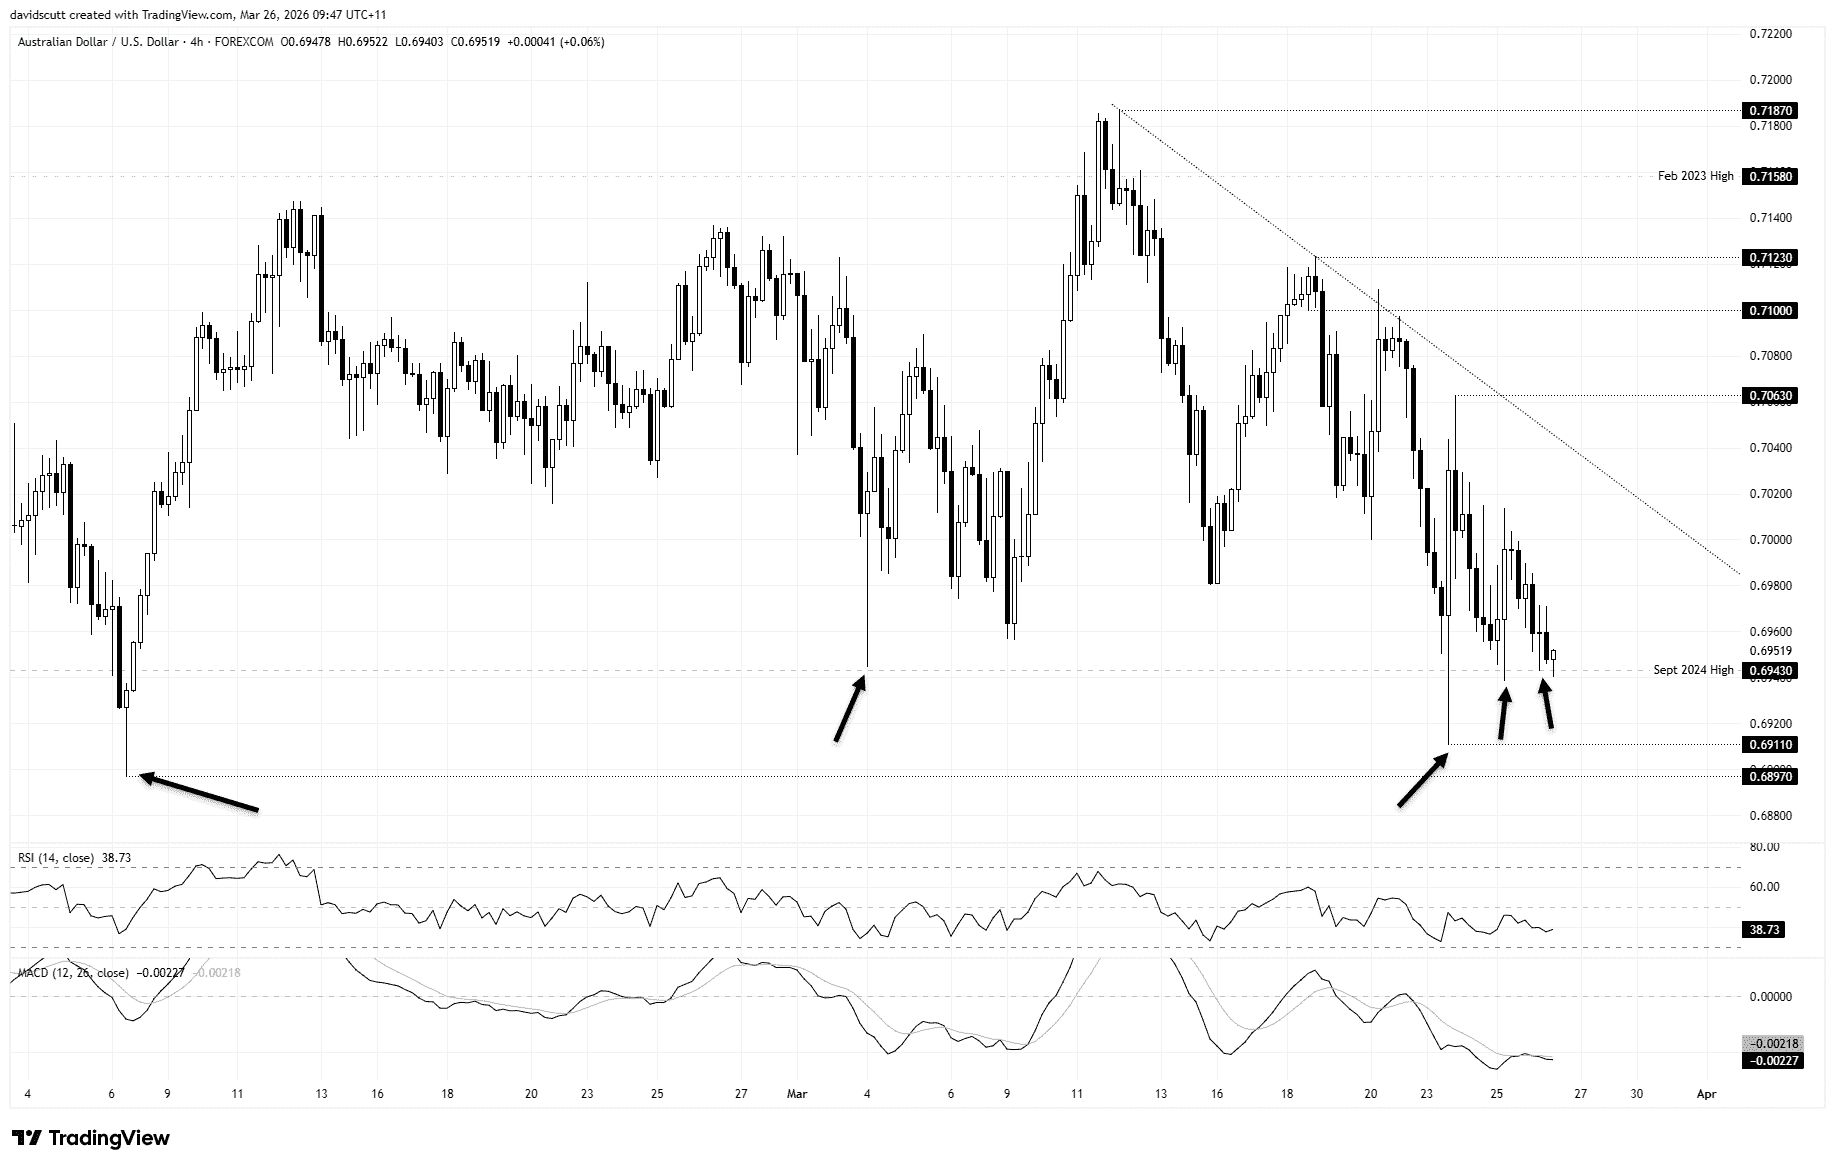
Source: TradingView
AUD/USD looks heavy on the H4 chart, grinding lower over much of the past fortnight. A string of lower highs, combined with RSI (14) and MACD continuing to send a consistent message that favours selling into strength with momentum with the bears, suggests the path of least resistance remains lower.
However, what’s notable is how well supported the pair has been on dips towards the September 2024 peak at 0.6943 over recent months, including over the past two weeks. That’s the level traders need to keep an eye on near-term.
Should bids continue to emerge beneath that level, countertrend longs could be considered with a tight stop below, initially targeting 0.7000 where offers have been parked so far this week. The downtrend from the March highs and the 0.7063 level set late last week are the levels of note overhead.
On the downside, should the bids beneath 0.6943 eventually be overrun, 0.6911 and 0.6897 are recent swing lows to keep on the radar. A sustained break below 0.6943 would allow for shorts to be set with a stop above for protection, but given the number of bounces we’ve seen there, a clean break and hold beneath would be preferable before acting.