


The US dollar softened on Tuesday after Federal Reserve Chair Jerome Powell signalled that an October rate cut remains likely and that quantitative tightening (QT) could be nearing its end. Meanwhile, the British pound held above its 200-day EMA despite weaker UK employment and wage data that fuelled expectations of a Bank of England (BoE) cut later this year.
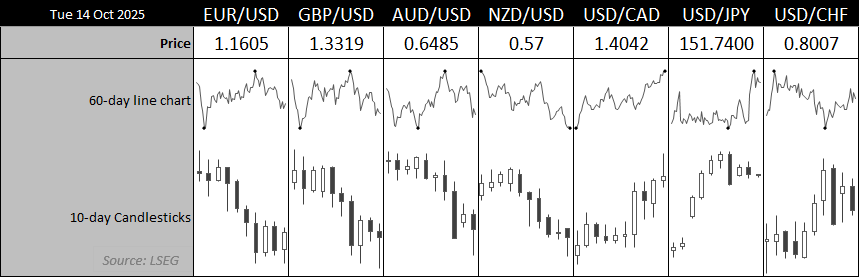
Chart analysis by Matt Simpson - data source: LSEG
View related analysis:
- US Dollar Rebound Appears Corrective, EUR/USD And GBPUSD Set To Bounce?
- British Pound Price Action Setups: GBP/USD, GBP/JPY
- AUD/USD, USD/JPY: Mild Rebound for Australian Dollar and Yen Faces Resistance
- Japanese Yen Selloff Losing Steam, AUD/JPY and AUD/USD Bears Resurface
US Dollar and Yields Decline After Powell’s Dovish Remarks
The US government shutdown has halted the flow of vital economic data used by the Federal Reserve (Fed) to guide its monetary policy. That also means traders lack the usual tools to anticipate the Fed’s next move. This uncertainty has helped bolster the US dollar on the assumption that no data means no action from the Fed — at least at its upcoming meeting. That was until Fed Chair Jerome Powell seemingly confirmed that an October rate cut is still on track and that the end of quantitative tightening (QT) could be nearing, during his speech to the National Association for Business Economics on Tuesday.
While Powell said data before the shutdown suggested that growth may be stronger than expected, he noted that “downside risks to the US jobs market have risen”. He admitted that the government data they lack is the “gold standard”, but added that the Fed has access to private data sources as an alternative. With Powell now signalling that QT may be nearing its end, the case for further rate cuts next year appears to be strengthening.
US yields were lower, with the 2-year yield falling to its lowest level since September 2022 at 3.48%. The 10-year yield sits just above 4% — a one-month low — and the 30-year yield is at a 17-month low of 4.6%. The US dollar index slipped slightly by -0.2%, and with it still trading below last week’s high, bullish momentum appears to be waning.

US Dollar Index (DXY) Falters, Yields Decline
Last week I reiterated my bias that the dollar’s current rally is corrective and that bears may be best served waiting for evidence of a swing high at higher levels. Not only could the 100 handle prove a tough nut to crack, given its round-number significance, but it also sits just above the August high and two 100% projection levels from the July and September swing lows.
That said, I cannot rule out another leg higher, given prices are coiling within a potential bullish pennant on the daily chart. Still, with the prospects of QT ending and rate cuts remaining on the table, I suspect we may be nearer the end of this corrective bounce than the beginning. And let’s not forget the TACO trade, which assumes the latest trade spat between the US and China could fizzle out ahead of the Trump–Xi summit. I will therefore continue to seek evidence of a swing high on the dollar’s daily chart to help identify potential swing lows elsewhere.
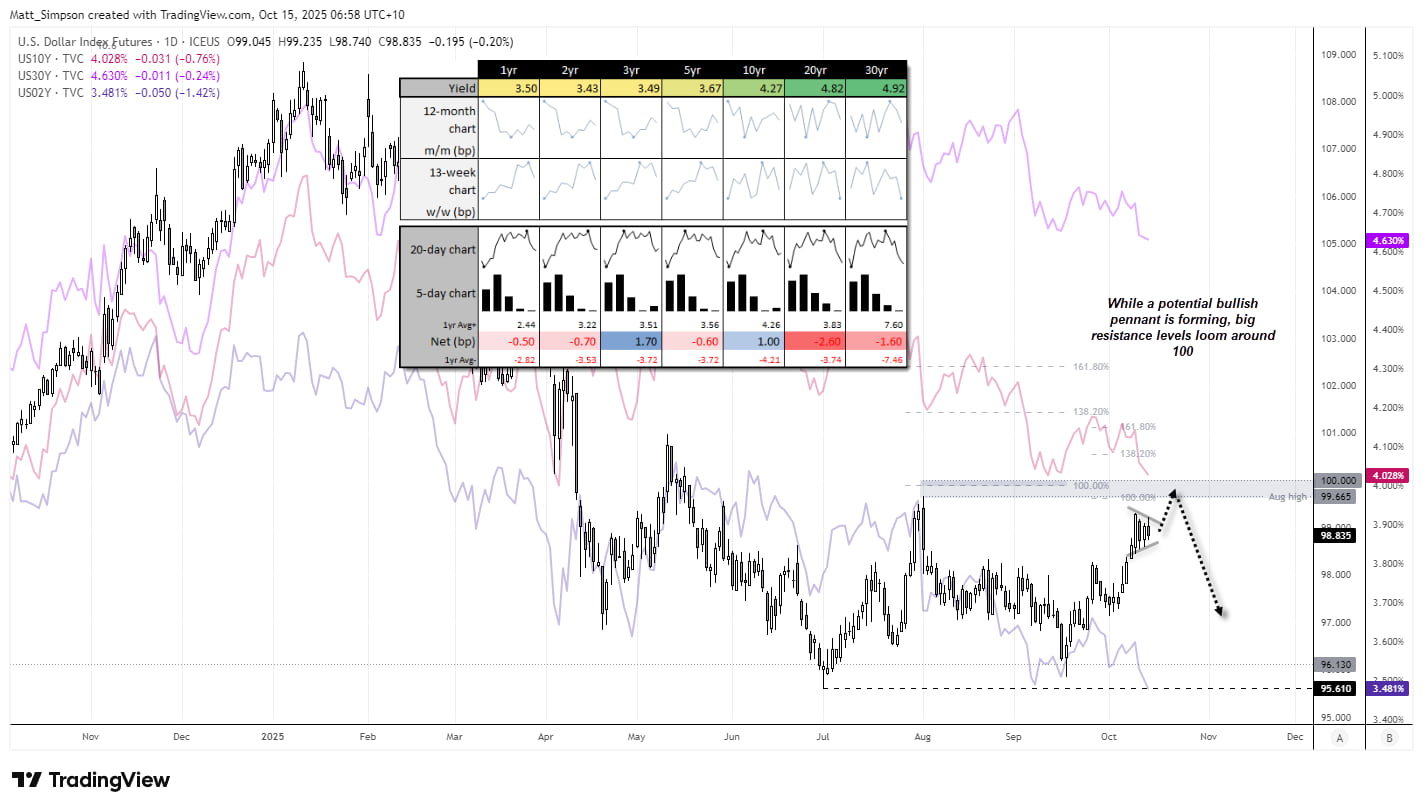
Chart analysis by Matt Simpson - data source: TradingView U.S. Dollar Index Futures, LSEG
GBP/USD Technical Analysis: British Pound vs US Dollar
The weaker US dollar allowed the British pound to hold above its 200-day average on Tuesday, despite softer employment and wages figures reigniting bets that the Bank of England (BoE) could cut rates sooner rather than later. That said, traders may be hesitant to become too bearish on sterling ahead of the looming Autumn Budget. From a price action perspective, when a market like GBP/USD repeatedly fails to break support, it often becomes a candidate for a countertrend move higher, in my view.
GBP/USD briefly dipped beneath its 200-day EMA on Tuesday to touch a two-and-a-half-month low. However, the weaker dollar helped the pair recoup most of its losses, and I suspect the initial break lower was likely a liquidity sweep. GBP/USD has since printed a bullish hammer at the 200-day EMA on the daily chart, suggesting we could see some mean reversion higher in the near term towards the 10-day EMA (1.3381), 20-day EMA (1.3420), or October VPOC (1.3420).
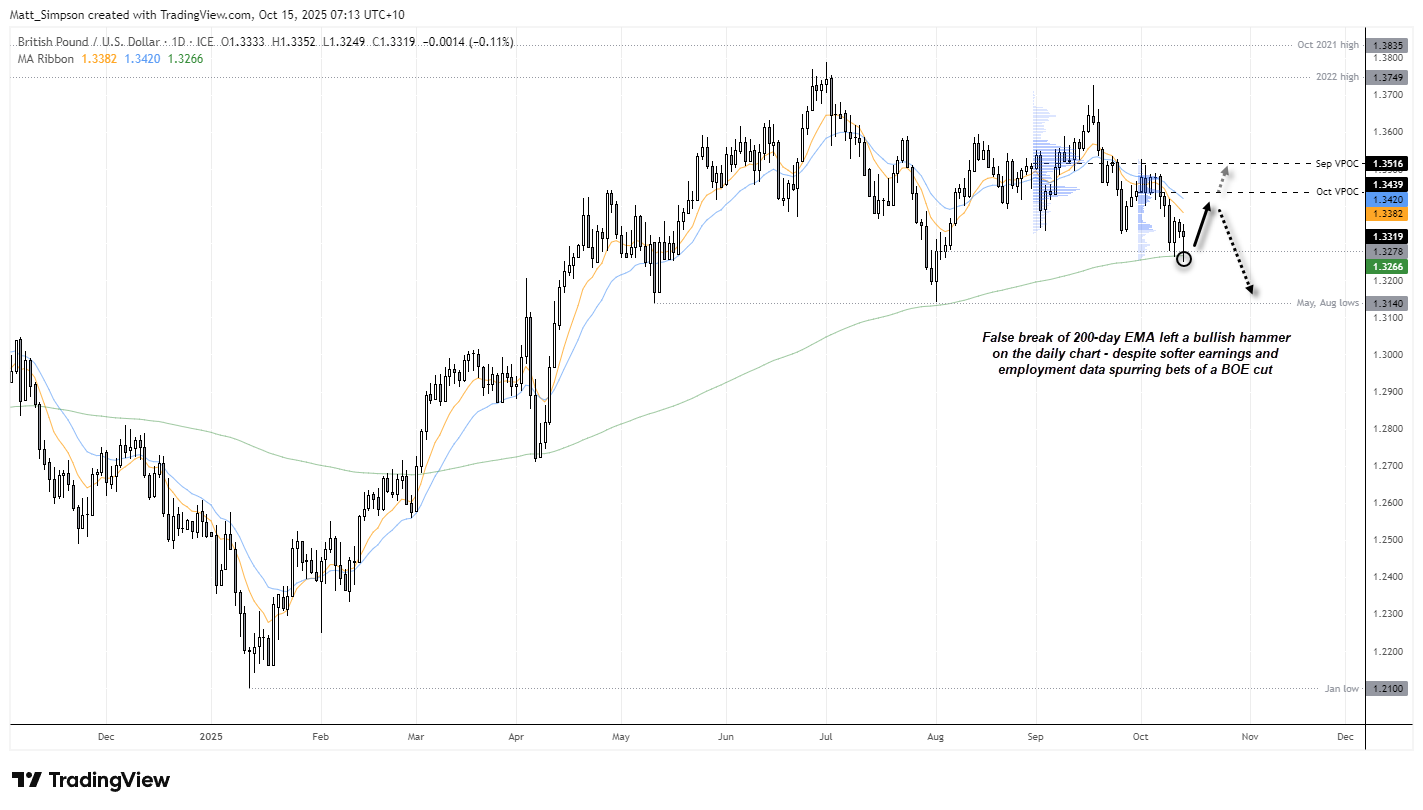
Chart analysis by Matt Simpson - data source: TradingView GBP/USD

Key Economic Events for Traders (AEDT / GMT+11)
11:00 AUD MI Leading Index (Sep) (AUD/USD, AUD/JPY, ASX 200)
12:30 CNY CPI, PPI (Sep) (USD/CNH, AUD/CNH, CN50 Index)
15:30 JPY Capacity Utilization, Industrial Production (Aug) (USD/JPY, EUR/JPY, Nikkei 225)
17:00 EUR German WPI (Sep) (EUR/USD, EUR/GBP, DAX)
18:40 EUR ECB’s De Guindos Speaks (EUR/USD, EUR/GBP, DAX)
19:00 GBP BoE MPC Member Ramsden Speaks (GBP/USD, EUR/GBP, FTSE 100)
19:00 EUR German Buba Vice President Buch Speaks (EUR/USD, EUR/GBP, DAX)
20:00 EUR Industrial Production (Aug) (EUR/USD, EUR/GBP, DAX)
20:30 EUR German 30-Year Bund Auction (EUR/USD, EUR/GBP, DAX)
21:00 USD IMF Meetings (S&P 500, Nasdaq 100, USD/JPY)
21:00 EUR German Buba Monthly Report, Reserve Assets Total (Sep) (EUR/USD, EUR/GBP, DAX)
22:00 USD MBA Mortgage Applications, 30-Year Rate, Purchase & Refinance Indexes (Sep) (S&P 500, Nasdaq 100, USD/JPY)
22:00 CNY M2 Money Stock, New Loans, Outstanding Loan Growth, Total Social Financing (Sep) (USD/CNH, AUD/CNH, CN50 Index)
23:30 USD NY Empire State Manufacturing Index, Real Earnings (Sep) (S&P 500, Nasdaq 100, USD/JPY)
23:30 CAD Manufacturing & Wholesale Sales (Aug) (USD/CAD, EUR/CAD, CAD/JPY)
02:00 GBP BoE Breeden Speaks (GBP/USD, EUR/GBP, FTSE 100)
03:10 USD FOMC Member Bostic Speaks (S&P 500, Nasdaq 100, USD/JPY)
04:00 USD Fed Waller Speaks (S&P 500, Nasdaq 100, USD/JPY)
View the full economic calendar
-- Written by Matt Simpson
Follow Matt on Twitter @cLeverEdge
How to trade with City Index
You can trade with City Index by following these four easy steps:
- Open an account, or log in if you’re already a customer
• Open an account in the UK
• Open an account in Australia
• Open an account in Singapore
- Search for the market you want to trade in our award-winning platform
- Choose your position and size, and your stop and limit levels
- Place the trade


