


US payrolls are faltering while wage growth accelerates, leaving the US dollar and Federal Reserve policy at a crossroads. Traders will closely watch Friday’s jobs report to see whether labour market weakness and rising pay can coexist without derailing the Fed’s rate-cut plans.
View related analysis:
- So how good is APD at predicting NFP, anyway?
- USD/JPY, AUD/USD Outlook: Volatility Within Range as US Dollar Rallies
- Japanese Yen Rebound, USD Weakness, Commodity FX Diverge: COT Report=
US Jobs Market Outlook: Payroll Weakness and Wage Pressures in Focus
To say the last Nonfarm Payrolls (NFP) report caused a stir would be an understatement. Not only did it spark market volatility, but it also led to the head of the Bureau of Labor Statistics being dismissed within hours of the release.
President Trump accused the revised figures of being “rigged” in favour of Democrats, particularly after June’s NFP was slashed from 147k to just 14k. July’s headline print of 73k jobs, against expectations of 111k, did little to calm the storm.
Markets were quick to react, with the US dollar falling on renewed bets of Federal Reserve (Fed) cuts. EUR/USD and gold rallied 1.5% by the day’s close, AUD/USD was up 0.7%, while USD/JPY fell -2.2%.
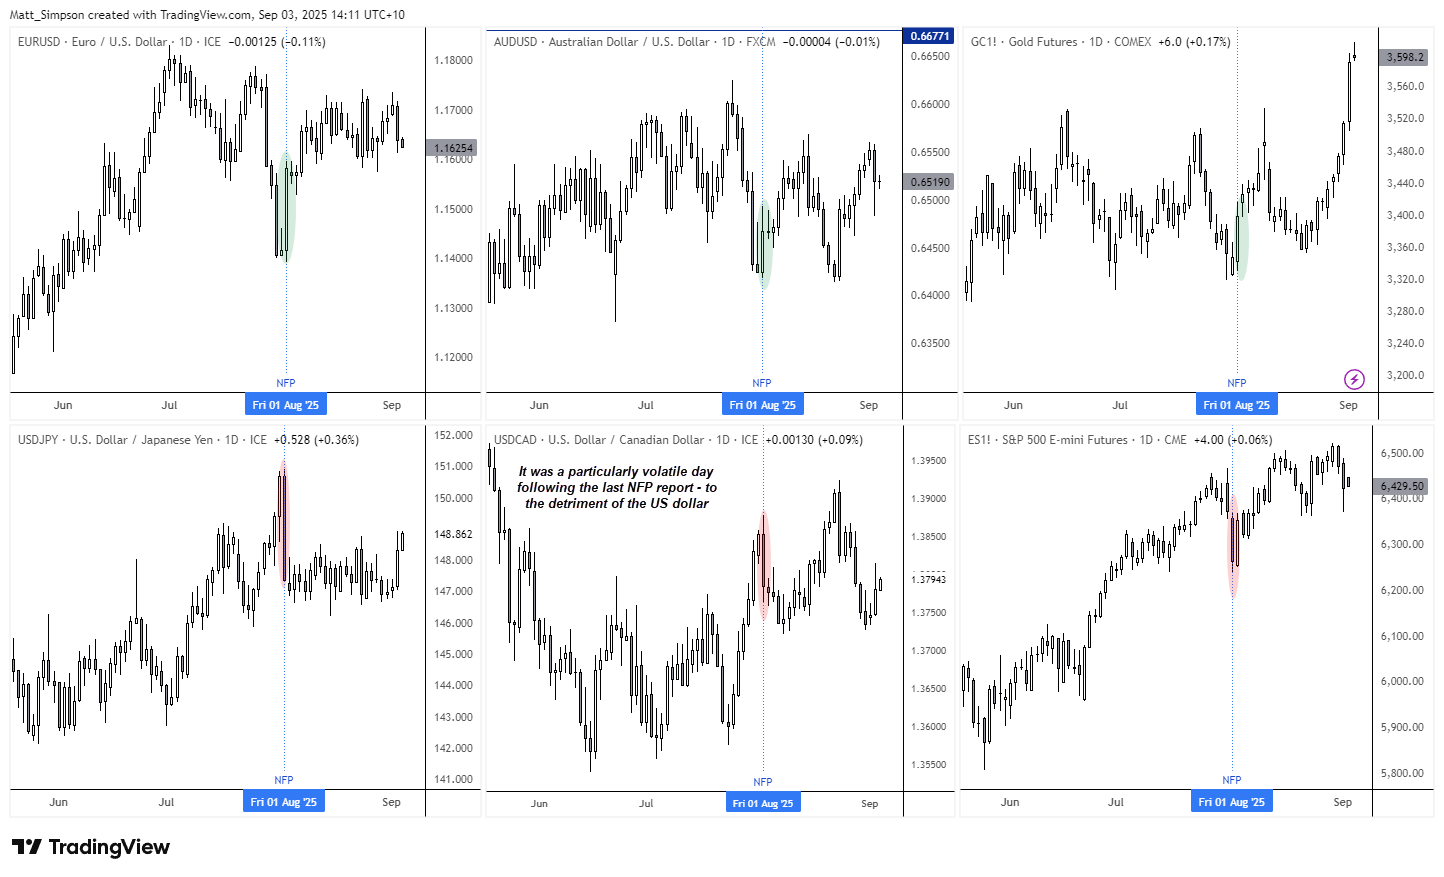
Chart prepared by Matt Simpson - data source: London Stock Exchange Group (LSEG)
Naturally, traders will be watching this Friday’s NFP closely to see whether July’s disappointment was an anomaly or the start of a more worrying trend. Looking through the data, however, I suspect we may need to brace for further weakness.
US job growth has been trending lower since its 2020 peak, making negative prints appear increasingly likely. In some ways, we’re already seeing cracks emerge. And that could favour another disappointing set of employment figures this week, which would no doubt fuel further calls from Trump for the Fed to cut rates and sink the US dollar.
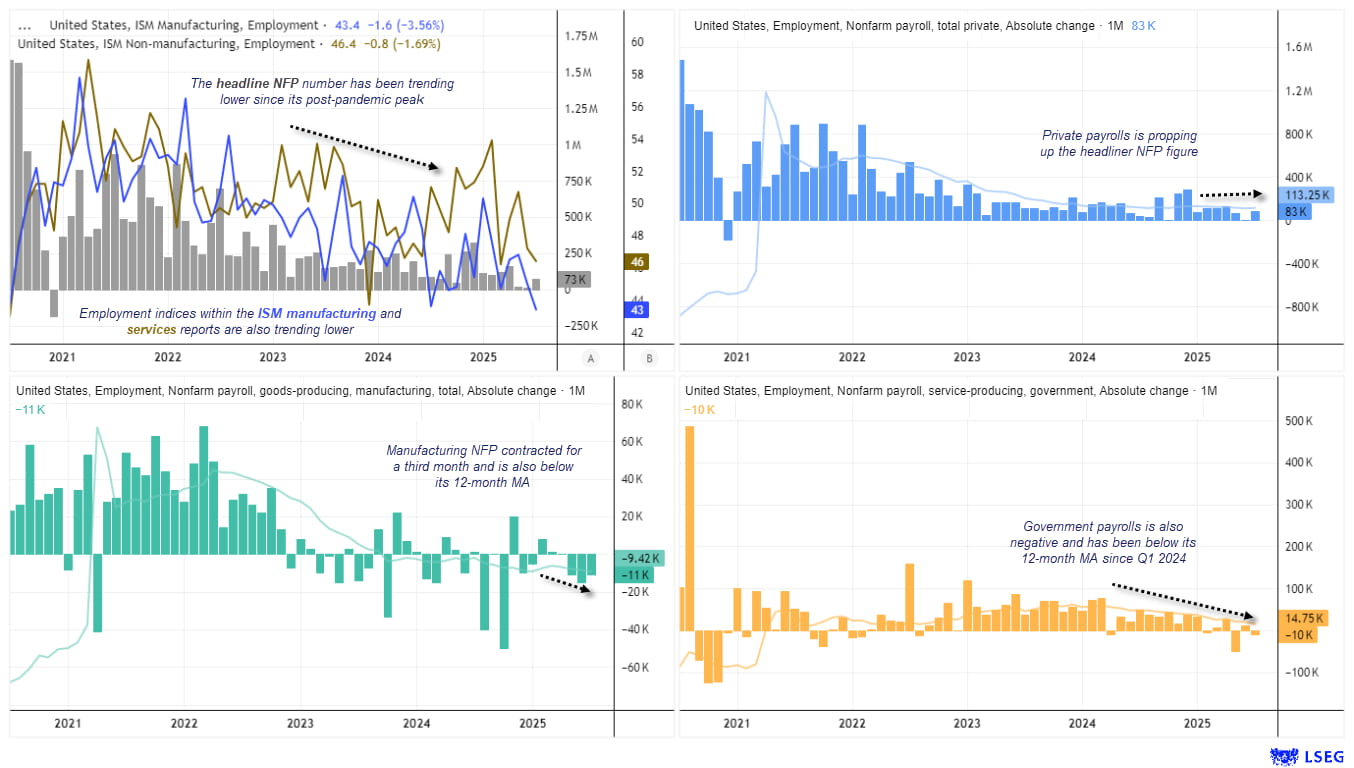
US Nonfarm Payrolls (NFP) trends show private payrolls propping up the headline figure, while manufacturing and government payrolls continue to weaken. Chart prepared by Matt Simpson - data source: Bureau of Labor Statistics (LBS), London Stock Exchange Group (LSEG).
- Manufacturing payrolls have contracted for three straight months, shedding a combined 36k jobs.
- Government payrolls dropped by 10k in July, 75k in May, and have tracked below their 12-month moving average since Q1 2024.
- Private payrolls remain the key support, adding 83k jobs in July compared to the headline 74k. Even so, they’ve been below their own 12-month moving average for three months and continue to trend lower alongside the headline figure.
- ISM manufacturing and services PMIs reinforce signs of labour market weakness, with both employment sub-indices trending lower. The manufacturing index has been in contraction, while services is steadily softening.
US Unemployment and Labour Participation
The unemployment rate remains historically low at 4.2%, but the participation rate has declined for three consecutive months to a 31-month low. With job growth barely positive and close to contraction, a rise in unemployment towards 5% by early next year seems increasingly likely. Such a shift could cap the recent uptick in wage growth, though the Federal Reserve will have noted its upward turn.
Wage Growth and Inflation Implications
While the US labour market is showing signs of fatigue, wage growth has begun to turn higher again, rising 3.9% year-on-year. That may not sound alarming in isolation, but with participation falling and unemployment edging higher, it creates an uneven backdrop for policymakers.
For the Federal Reserve, a sustained pickup in wages would complicate the path to rate cuts. Inflationary pressures could remain sticky even as the jobs market weakens, forcing the Fed to balance rising slack in employment with the risk of renewed price growth.
For traders, this means Friday’s NFP report isn’t just about the headline jobs number — the wage growth component may prove equally market-moving. A hotter-than-expected print could lift US yields and the dollar in the short term, while a miss would reinforce expectations for earlier Fed easing.
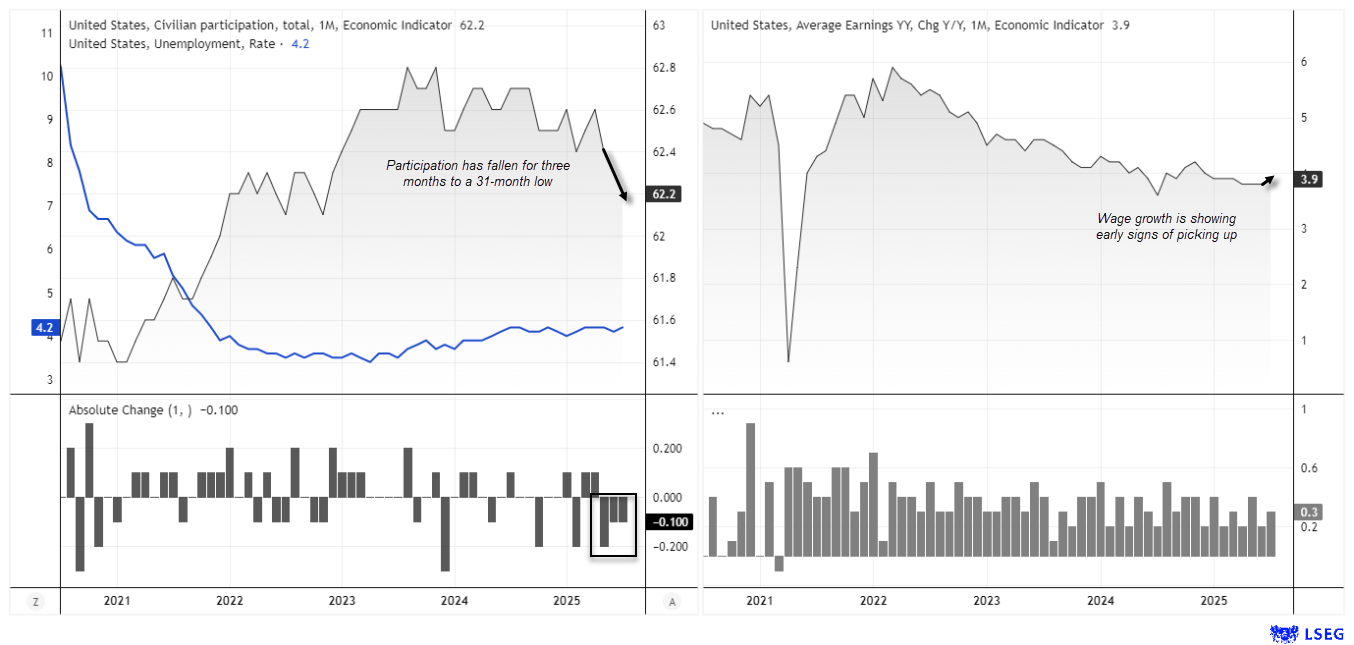
US unemployment rate steady at 4.2% while labour force participation falls to a 31-month low. Wage growth shows early signs of picking up. Source: LSEG
U6 Unemployment – Gauging Hidden Labour Market Slack
For a broader look at unemployment in the US, economists and the Fed often consider U6 unemployment. This includes the official unemployment rate (U3), plus:
- Marginally attached workers (want a job but are not actively searching)
- Discouraged workers (have stopped looking due to lack of perceived opportunities)
- Involuntary part-time workers (seeking full-time work but stuck in part-time roles)

US labour market slack is widening, with the U6–U3 spread rising as underemployment climbs, though not yet at recessionary levels. Chart prepared by Matt Simpson - data source: Bureau of Labor Statistics (LBS), London Stock Exchange Group (LSEG)
Because of these additions, U6 is always higher than U3, but the spread between them can highlight labour market slack that headline unemployment misses.
- U6 unemployment has trended higher since July 2023 and now sits at 7.9%, close to its highest since June 2021.
- This is above its 7.3% average since the December 2022 post-pandemic trough.
- However, it remains well below its long-term average of 10.4%, which includes recessionary periods.
- The U6–U3 spread is also widening, signalling more underemployment relative to headline unemployment. While not yet recessionary, it highlights growing slack in the labour market.
US Dollar Index (DXY) Technical Analysis
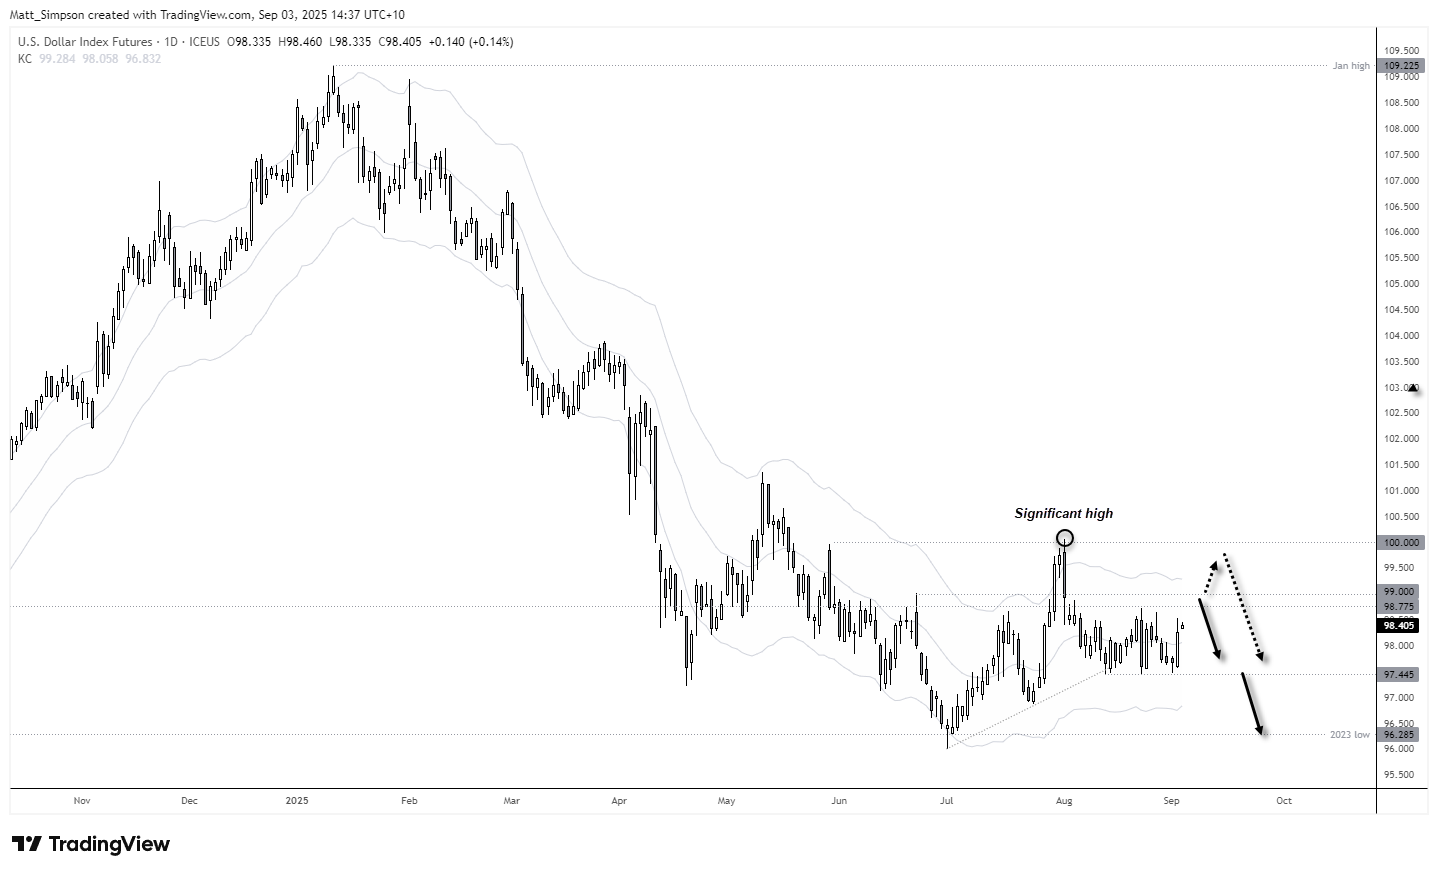
Bulls have successfully defended the 97.45 support level, leaving the US dollar index (DXY) at risk of a larger rebound if wage growth accelerates and Friday’s NFP does not deliver another weak print. While a move towards 100 remains questionable, a temporary break above 99 cannot be ruled out before the next leg lower.
My broader bias remains bearish into Q4, with expectations that the Federal Reserve will eventually signal further cuts beyond September. The timing of renewed downside momentum may hinge on this week’s payrolls: a weak jobs report coupled with capped earnings would likely push the dollar decisively below 97.45, resuming its downtrend.
![]()
Chart analysis by Matt Simpson - data source: TradingView U.S. Dollar Index Futures
View the full economic calendar
-- Written by Matt Simpson
Follow Matt on Twitter @cLeverEdge
How to trade with City Index
You can trade with City Index by following these four easy steps:
- Open an account, or log in if you’re already a customer
• Open an account in the UK
• Open an account in Australia
• Open an account in Singapore
- Search for the market you want to trade in our award-winning platform
- Choose your position and size, and your stop and limit levels
- Place the trade


