


USD/CAD has rebounded from key technical support back in July, and momentum is turning higher once again. While the move appears corrective, scope remains for further upside towards the 1.39 handle (or even 140) before the larger trend kicks back in. For now, futures traders are moving against the Canadian dollar, which further support a bullish case for USD/CAD over the near term.
View related analysis:
- AUD/USD, EUR/AUD Technical Outlook: Australian Dollar Under Pressure
- AUD/JPY Dips to Support, Australian Full-Time Jobs Bounce
- US Dollar Probes Trend Support Ahead of PPI, AUD/USD in Focus for Jobs
USD/CAD Technical Analysis: US Dollar vs Canadian Dollar
The Canadian dollar spent much of February through June in a steep decline against the US dollar, with USD/CAD falling 8.5% after President Trump paused tariffs for Canada, Mexico, and China. Support emerged around 1.36, aligning with a multi-month high-volume node (HVN) and the 200-week EMA.
While the current rebound appears corrective — suggesting USD/CAD may eventually resume its move below 1.36 — there is scope for bulls to push higher before any reversal develops.
Whether USD/CAD can test the 1.40 handle, near the 2022 high at 1.3977, will depend on how resistant the Federal Reserve remains to the Trump administration’s calls for deeper interest rate cuts. Policy expectations from the Bank of Canada (BoC) also play a role, with next week’s Canadian inflation data a key driver to watch. For now, the daily chart points to at least one more leg higher, while market positioning data indicates that traders are rebuilding short exposure to the Canadian dollar.
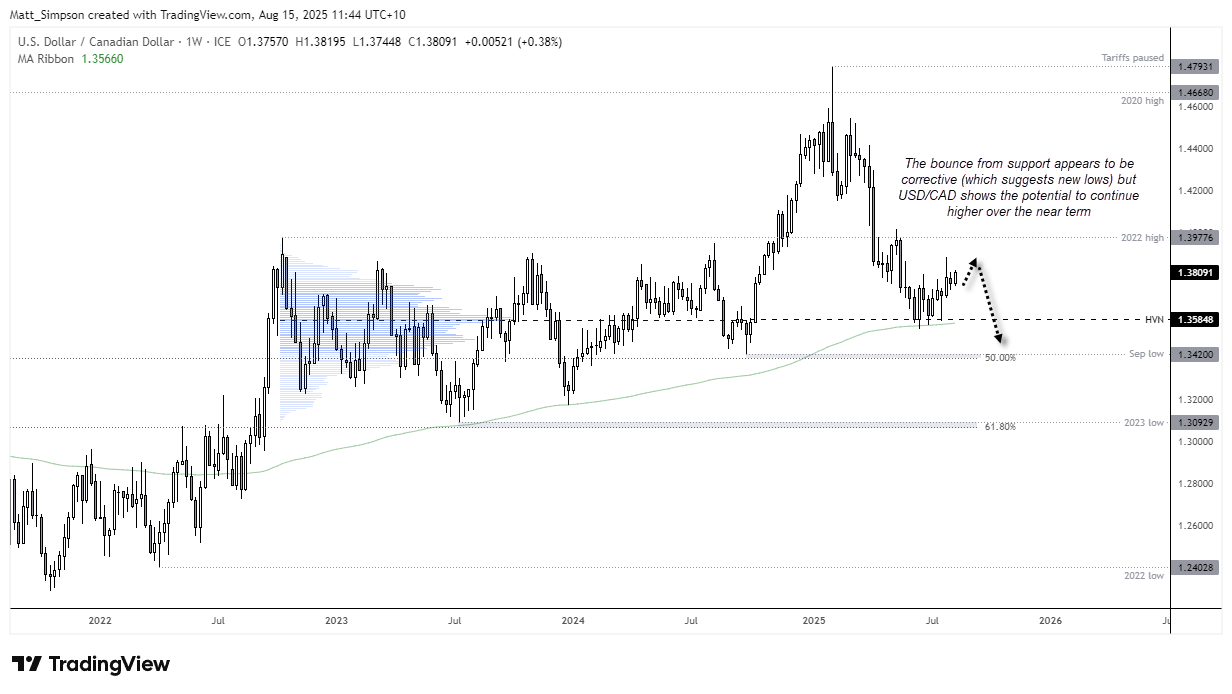
Chart analysis by Matt Simpson - data source: TradingView USD/CAD
CAD/USD Positioning: Canadian Dollar Futures – Weekly COT Report
Asset managers have held a net-short position in the Canadian dollar since early 2024, while large speculators have been net-short since mid-2023. The recent trend is key — net-short exposure for both groups has been rising in recent weeks as the Canadian dollar weakens, strengthening the case for USD/CAD bulls.
Furthermore, asset managers (real money accounts) have been reducing gross longs while adding to shorts, reinforcing the bullish technical setup highlighted on the daily chart.

Chart analysis by Matt Simpson - data source: TradingView USD/CAD
USD/CAD Technical Analysis: Daily Chart
The daily chart shows that on three occasions, bears attempted but failed to break USD/CAD below the HVN just under 1.36. Each attempt resulted in a solid bounce, with the third driving prices to a 10-week high. Prices have since retraced into a strong support zone, comprising the 50% retracement level, 50-day EMA, and monthly pivot point. Furthermore, Thursday formed a bullish engulfing candle and a higher low, using the monthly pivot as a launch point.
- Bulls may look to buy dips within Thursday’s range and keep a bullish bias while prices remain above Thursday’s low (1.3745).
- The 1.3879 high near the 200-day EMA presents a potential near-term upside target.
- A break above 1.39 would bring the monthly R1 pivot, 2022 high, and the 1.40 handle into focus.
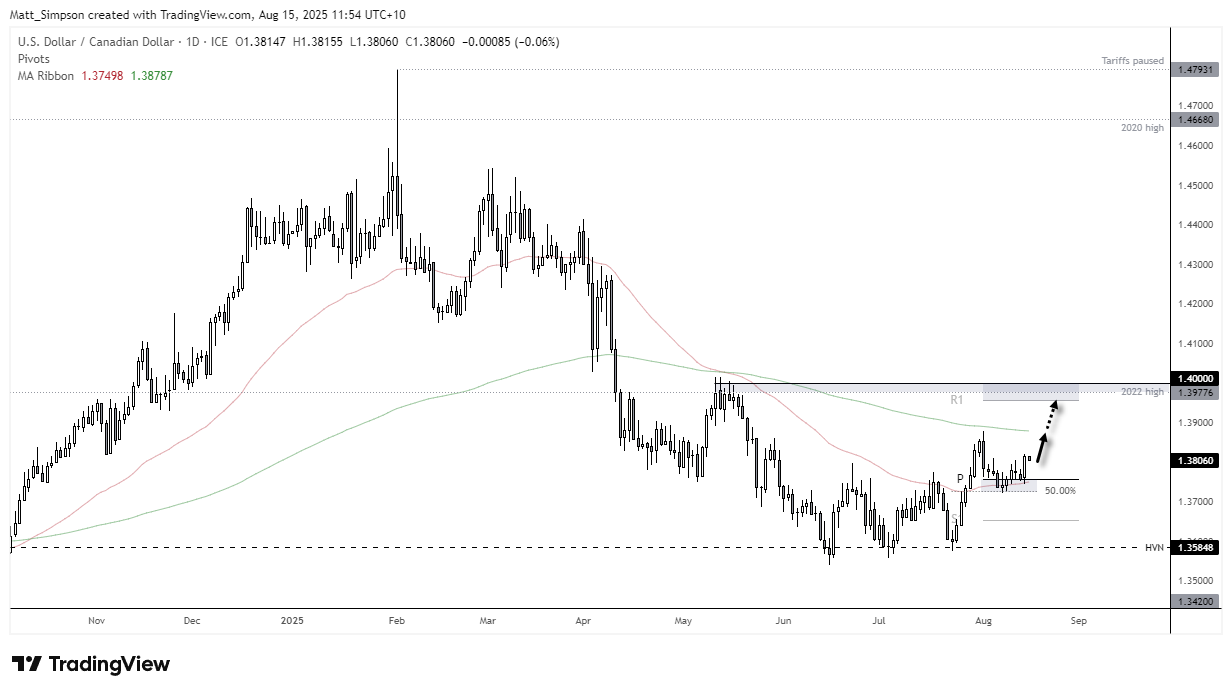
Chart analysis by Matt Simpson - data source: TradingView USD/CAD
View the full economic calendar
-- Written by Matt Simpson
Follow Matt on Twitter @cLeverEdge
How to trade with City Index
You can trade with City Index by following these four easy steps:
- Open an account, or log in if you’re already a customer
• Open an account in the UK
• Open an account in Australia
• Open an account in Singapore
- Search for the market you want to trade in our award-winning platform
- Choose your position and size, and your stop and limit levels
- Place the trade


