


Last week’s commitment of Traders (COT) report revealed a few interesting moves across the major asset classes. Bond traders are piling into the short end of the curve via the 2-yeare Treasury on the assumption of lower yields. On the volatility front, VIX net-short exposure has climbed to its highest level in almost four years, hinting at growing complacency ahead of a seasonally volatile September. In FX, GBP/USD short sellers were caught out by the Bank of England’s (BOE) rate-cut reaction, while AUD/USD bears are positioning for an expected RBA cut. Over in commodities, WTI crude oil remains under heavy selling pressure, but current positioning suggests a potential cycle low may be forming.
View related analysis:
- AUD/USD Weekly Outlook: RBA Set for Cautious Cut as US CPI Looms
- USD/JPY, GBP/JPY Outlook: Trump Eyes Fed Shakeup, BOE Rattle Pound Bears
- USD Selloff Stabilises Amid Mixed ISM, Trump’s Fed Pick
- AUD/USD Weekly Outlook: Fed Bets Boost Aussie as US Data Weakens
Weekly Market Positioning Overview – COT Report Highlights (5 Aug 2025)
- US Dollar (USD): Asset managers trimmed net-short exposure to the USD index for a third week
- European dollar (EUR): Net-long exposure fell -7.4k contracts among large speculators
- British pound (GBP): Large speculators reduced gross-longs by -22.1k contracts (fastest weekly pace in one year)
- Japanese yen (JPY): Net-long exposure fell to a 22-month low with shorts rising 7.4% (5.5k)
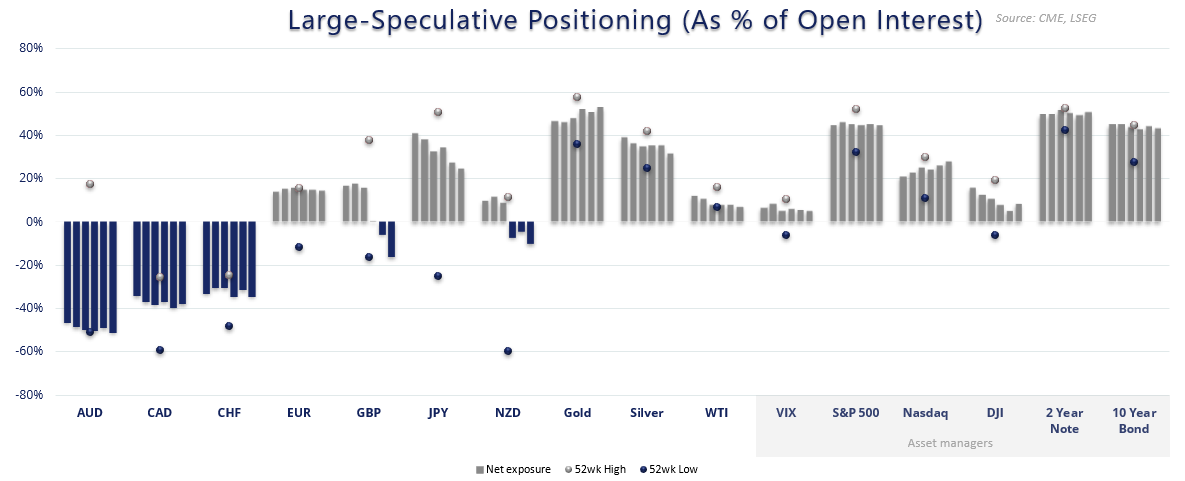
- Australian dollar (AUD): Large speculators pushed net-short exposure up to an 16-month high
- Canadian dollar (CAD): While net-short exposure increased by 3k contracts, gross-longs rose by 24% (4.2k contracts)
- Swiss franc (CHF): Large speculators reduced gross-longs by -24% (-2.2k contracts)
- New Zealand dollar (NZD): Large specs were net-short for a third week, though only by -4.8k contracts
- Gold (GC): Net-long exposure top gold rose ~33k between large specs and managed funds
- Crude Oil (WTI): Short bets against crude oil continued to trend higher among managed funds and large specs
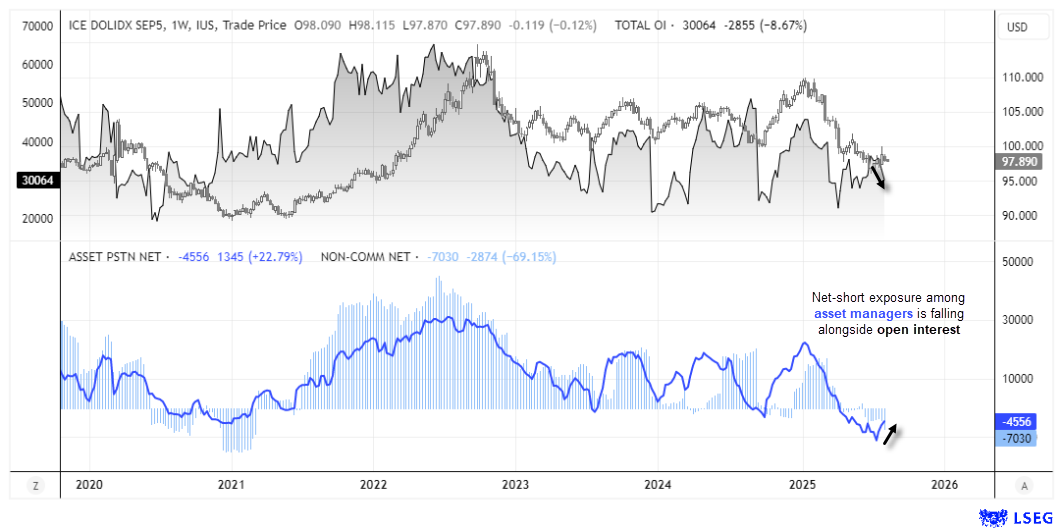
US Dollar Index (USD) Positioning – COT Report Analysis
It remains unclear whether the US dollar will resume its dominant bearish trend or stage a countertrend bounce. Last week’s small bearish inside week offered no clear signal.
Asset managers — often early movers on USD direction — cut gross shorts on the USD index by 36% last week and 18% the week before. While this trimming of bearish exposure is noteworthy, gross longs remain low, showing hesitancy to buy the struggling dollar.
With open interest down 9% in thin seasonal trade, tomorrow’s US CPI may be the catalyst that defines the next leg for USD.

GBP/USD Positioning – British Pound Futures Analysis
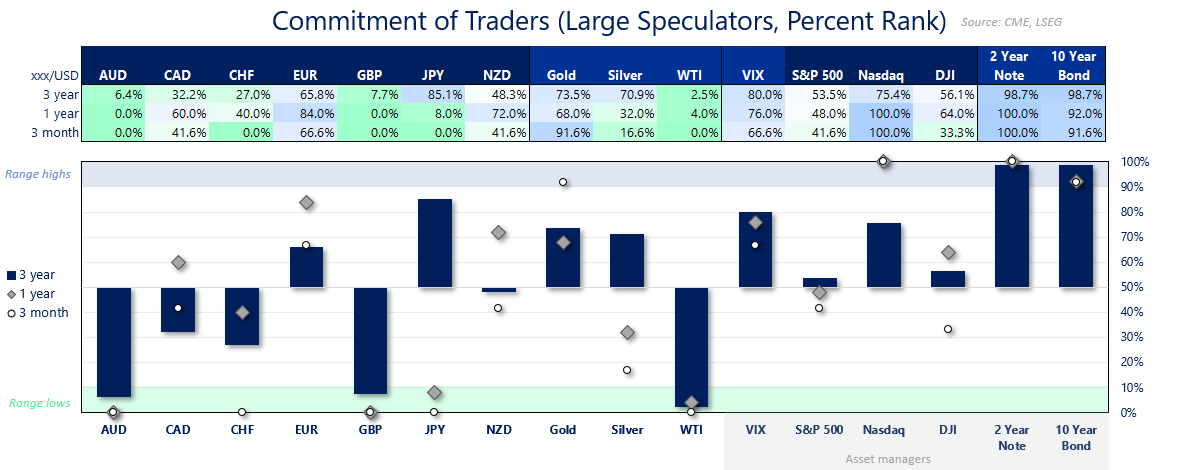
Ahead of last week’s Bank of England meeting, asset managers pushed net-short exposure in the British pound to its most bearish level in 15 months. Large speculators were net-short for a second week, at their most bearish since November 2022.
However, the BOE’s rate cut was not as dovish as expected, sending GBP/USD sharply higher and hinting at a potential swing low on the weekly chart. This positioning skew could fuel further gains if the pair clears near-term resistance.
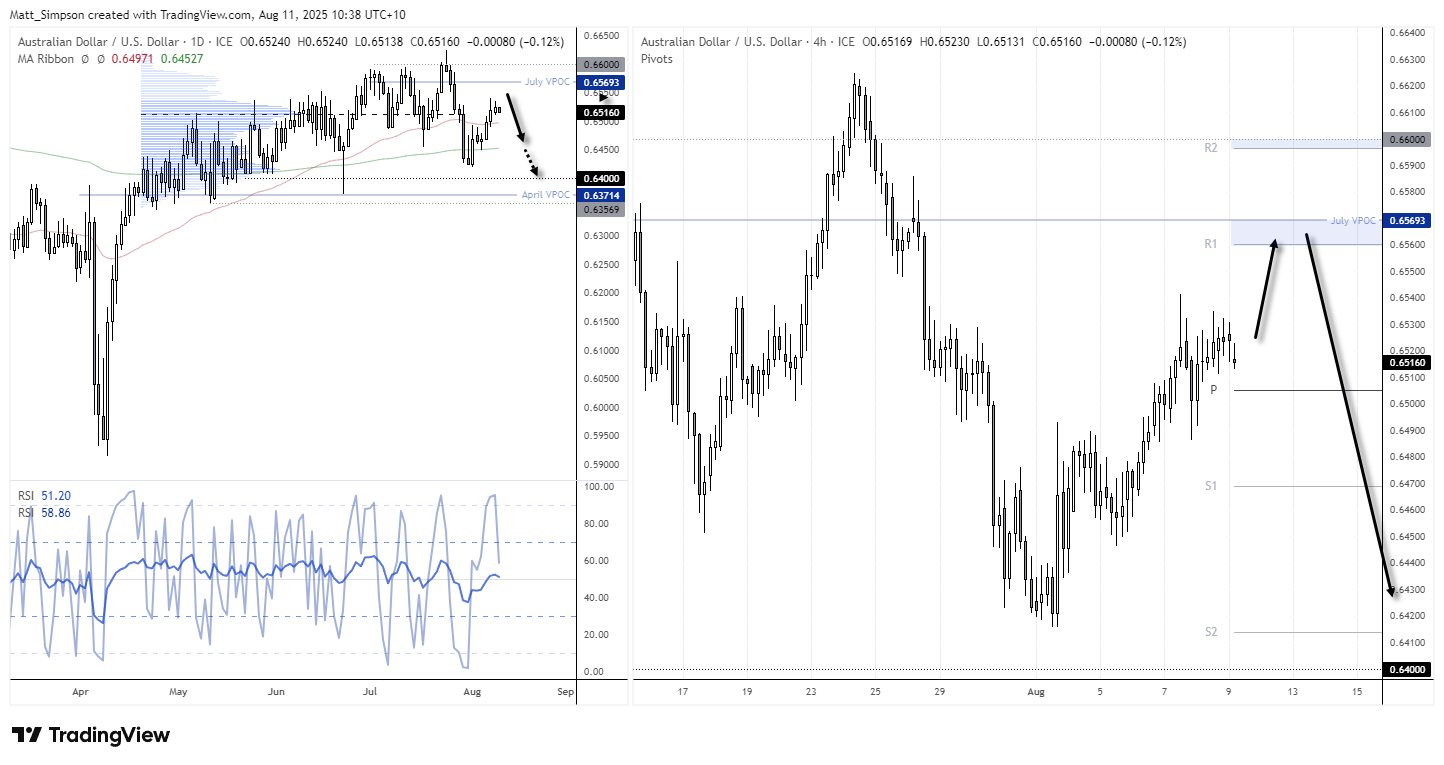
AUD/USD Positioning – Australian Dollar Futures Outlook
Futures traders increased net-short exposure in the Australian dollar to a 16-month high ahead of this week’s RBA meeting, where a 25bp cut is widely anticipated. The risk for bears is if the RBA avoids dovish forward guidance.
Adding to the potential volatility, US CPI data tomorrow could weigh on the Aussie if inflation comes in hot — especially given the uptick in ‘prices paid’ from the latest ISM services report.
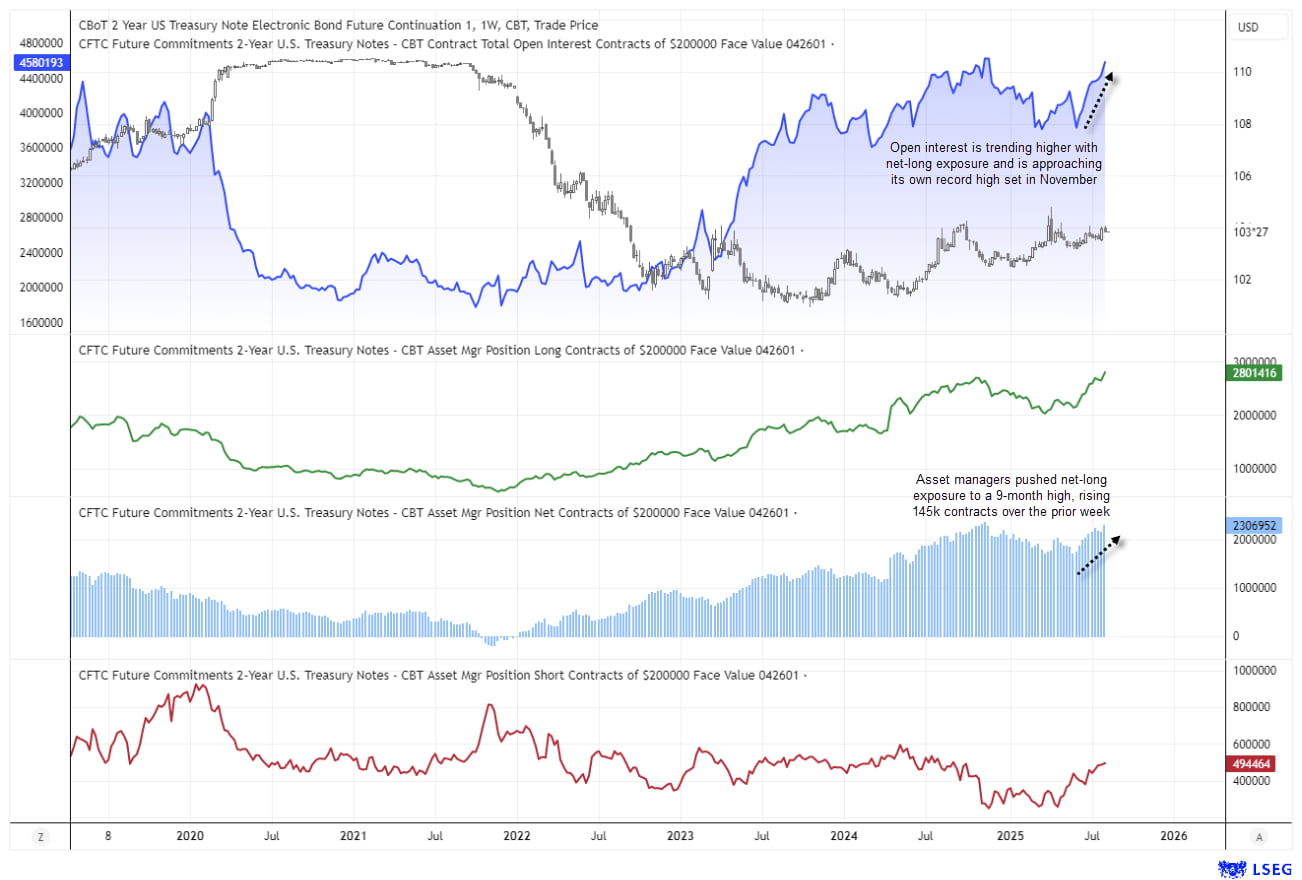
US 2-Year Treasury Note Positioning – COT Report Insights
Renewed expectations for a September Fed rate cut drove the biggest bullish build in 2-year Treasury note positions in 16 weeks, with asset managers adding 145k net-long contracts.
Net-long exposure is now at its highest since November’s record, and open interest is close to matching that peak — signalling strong conviction and potential downward pressure on yields.
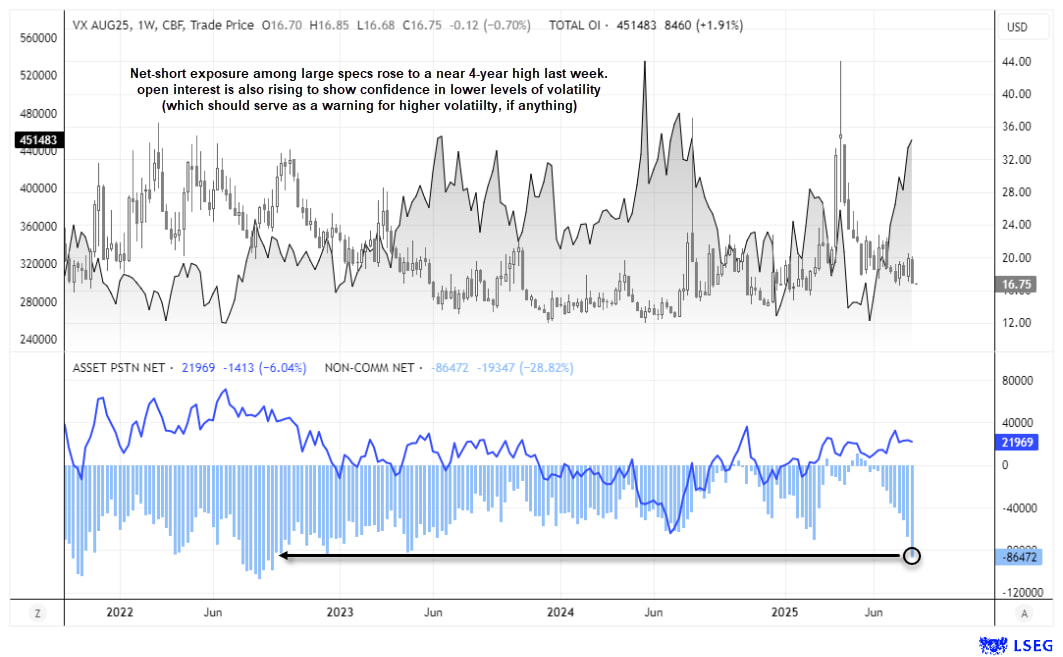
VIX Futures Positioning – Volatility Outlook
Large speculators are the most net-short on volatility since September 2022, holding 86.4k contracts. Open interest also hit its highest since August 2024, showing strong confidence in low volatility conditions.
Historically, such crowded short-volatility positions can precede sharp spikes, with risk increasing as we approach September’s seasonally higher volatility period.
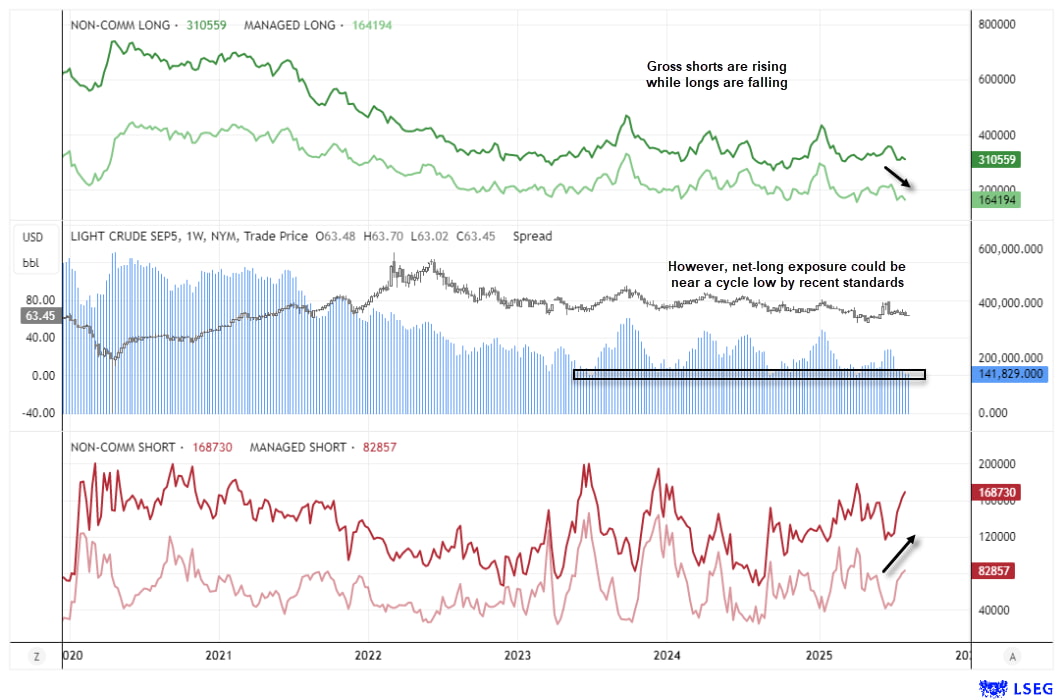
WTI Crude Oil Positioning – Bearish Sentiment Near Cycle Lows
Bearish positioning in WTI crude oil deepened last week, with large speculators and managed funds increasing gross shorts and cutting gross longs. Net-long exposure is now at its lowest since March–April.
While price action remains weak, history shows such levels often precede rebounds, making this a zone for bears to be cautious and bulls to monitor for potential swing lows.
View the full economic calendar
-- Written by Matt Simpson
Follow Matt on Twitter @cLeverEdge
How to trade with City Index
You can trade with City Index by following these four easy steps:
- Open an account, or log in if you’re already a customer
• Open an account in the UK
• Open an account in Australia
• Open an account in Singapore
- Search for the market you want to trade in our award-winning platform
- Choose your position and size, and your stop and limit levels
- Place the trade


