


The US dollar and Japanese yen both weakened on Tuesday, leaving JPY crosses in focus ahead of pivotal central bank decisions. Traders are bracing for the Federal Reserve to deliver a 25bp cut while signalling the path for future easing, with market pricing leaning towards another 50bp of cuts by year-end. Meanwhile, the Bank of Japan’s upcoming meeting could add further volatility for the yen. Against this backdrop, USD/JPY shows signs of a bearish breakdown, while EUR/JPY and AUD/JPY retain bullish momentum.
View related analysis:
- EUR/USD and GBP/USD Outlook: Bullish Patterns Form as Dollar Wavers
- USD/CAD, EUR/CAD Outlook: Canadian Dollar Bulls Flex Ahead Inflation
- British Pound Price Action Setups: GBP/USD, GBP/JPY, GBP/CAD, GBP/AUD
- EUR/USD, USD/JPY, VIX, Gold, Crude oil: COT Report Analysis
- USD/JPY and Yen Crosses Analysis: Jobs Revision, Fed Cuts, Technical Outlook
US Dollar Weakness and Market Expectations for the Fed
The US dollar was the weakest FX major on Tuesday, with traders front-running expectations of a dovish Fed cut at this week’s meeting. This, of course, raises the risk of a sharp bullish reversal in the USD should the Fed fail to support current market pricing of another 50bp of cuts this year, alongside the expected 25bp cut on Wednesday. That said, I do not expect the Fed to deliver a 50bp cut at this meeting—partly to save face amid Trump’s persistent pressure to cut, but mostly to avoid triggering unnecessary, widespread panic. Traders would likely view a 50bp cut as confirmation that the Fed is indeed behind the curve.
Swiss Franc Strength: USD/CHF Hits Lowest Since 2015
The Swiss franc (CHF) was the strongest FX major, sending USD/CHF down 1% to its lowest level since January 2015—the infamous day the Swiss National Bank (SNB) removed the franc’s peg to the euro. This places the Swissy firmly below levels where the SNB has previously intervened to support its currency.
EUR/USD Breaks Higher on Strong Data and Dovish Fed Bets
EUR/USD reached a near four-year high on Tuesday on stronger-than-expected European data and pre-emptively dovish Fed bets against the US dollar ahead of the FOMC meeting. Germany’s ZEW economic sentiment rose to 37.3, beating the 25.3 estimate and above the 34.7 prior. This marked its fifth consecutive expansion and places it well above its long-term average of 21.1.
The euro’s 0.8% gain was its best day in over three weeks, bringing the July and October 2021 highs near 1.1908 and the 1.20 handle into focus for bulls, in line with my bullish bias. EUR/USD bulls have enjoyed a clean breakout from the inverted head and shoulders pattern.
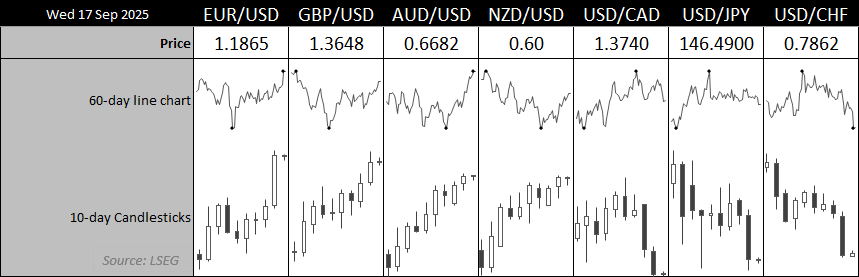
FX Majors Rundown
- GBP/USD broke higher from its own inverted head and shoulders pattern, reaching a 2.5-year high.
- AUD/USD rose 0.2% to its highest level since November, though resistance was predictably met around the 200-day averages and November high.
- NZD/USD climbed to a 22-day high, though resistance at the August high of 0.5996 is nearby.
- USD/JPY fell -0.6% and saw its most bearish daily close level since 23 July
- USD/CAD continued lower in line with my bearish bias, with a move down to at least 1.36 now on the cards. While CPI came in below expectations—keeping the Bank of Canada (BoC) on track for a 25bp cut later today—it remains elevated enough to warrant caution on future cuts.
- US dollar index (DXY) fell 0.7% to a two-month low, with a break of the July trough at 95.61 now in focus for bears.

USD/JPY Technical Analysis: US Dollar vs Japanese Yen
For several weeks I have noted that USD/JPY has been ranging between two weekly volume points of control (VPOCs). As is often the case with ranges, there have been several twists and turns around these hidden support and resistance levels, each with their broken promise of a bullish or bearish breakout. But with USD/JPY printing its lowest daily close of the range—and volumes rising during yesterday’s selloff—I am once again on guard for a bearish breakout. Only a less-dovish-than-expected Fed meeting could derail this and send USD/JPY bolting higher within the range. A break beneath the 145.75 low opens up the prospect of a move towards the 144 handle, near the high-volume node (HVN) at 143.82.
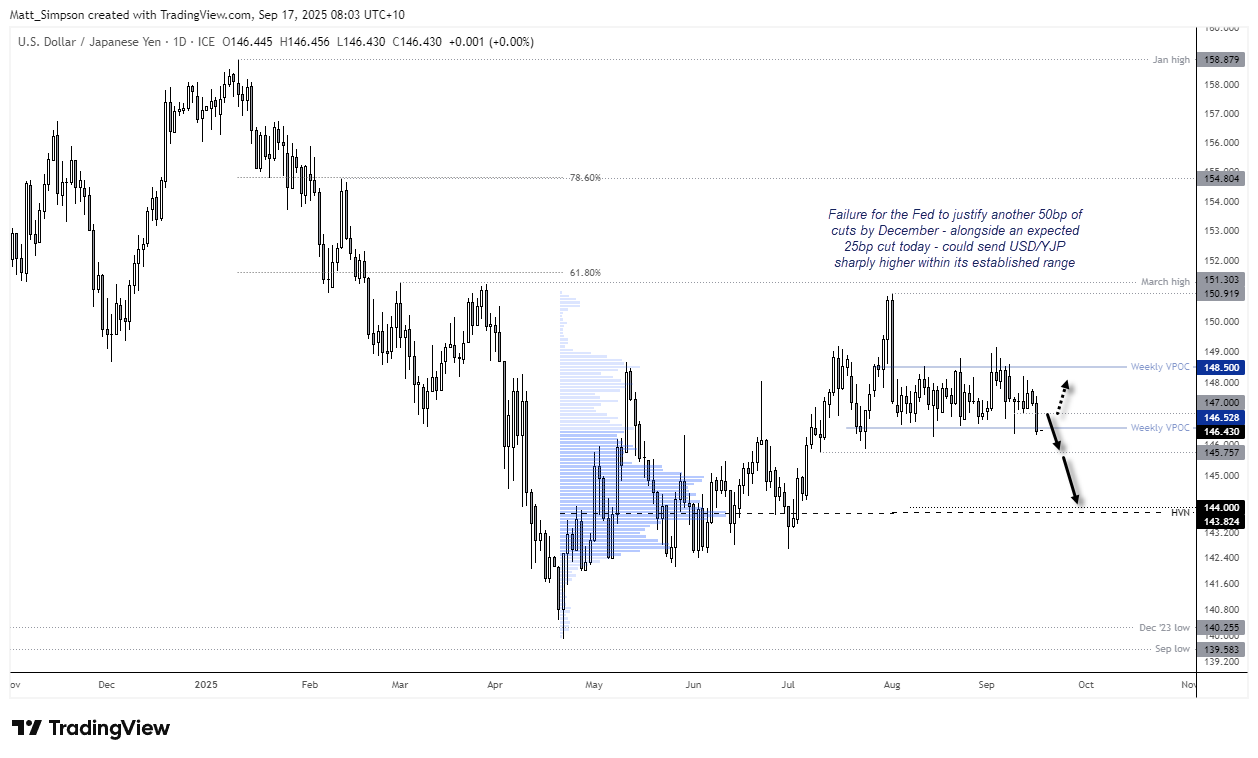
Chart analysis by Matt Simpson - data source: TradingView USD/JPY
USD/JPY Technical Analysis: 1-Hour Chart
The 1-hour chart shows bearish momentum on USD/JPY accelerating into the lows, with trading volumes rising during the decline from 147.50 to 146.52. While volumes eased afterwards, the cumulative volume delta (CVD) remained deeply negative, signalling that the vast majority of trades were bearish.
USD/JPY is currently oscillating around a weekly VPOC and the S1 pivot level, while holding just above the August low. Traders should be on guard for near-term bounces heading into the FOMC, but the technical bias favours a bearish breakout overall. Any rebound may present opportunities for bears to reload at higher levels, anticipating renewed downside for the US dollar against the Japanese yen following the Fed and BoJ meetings.
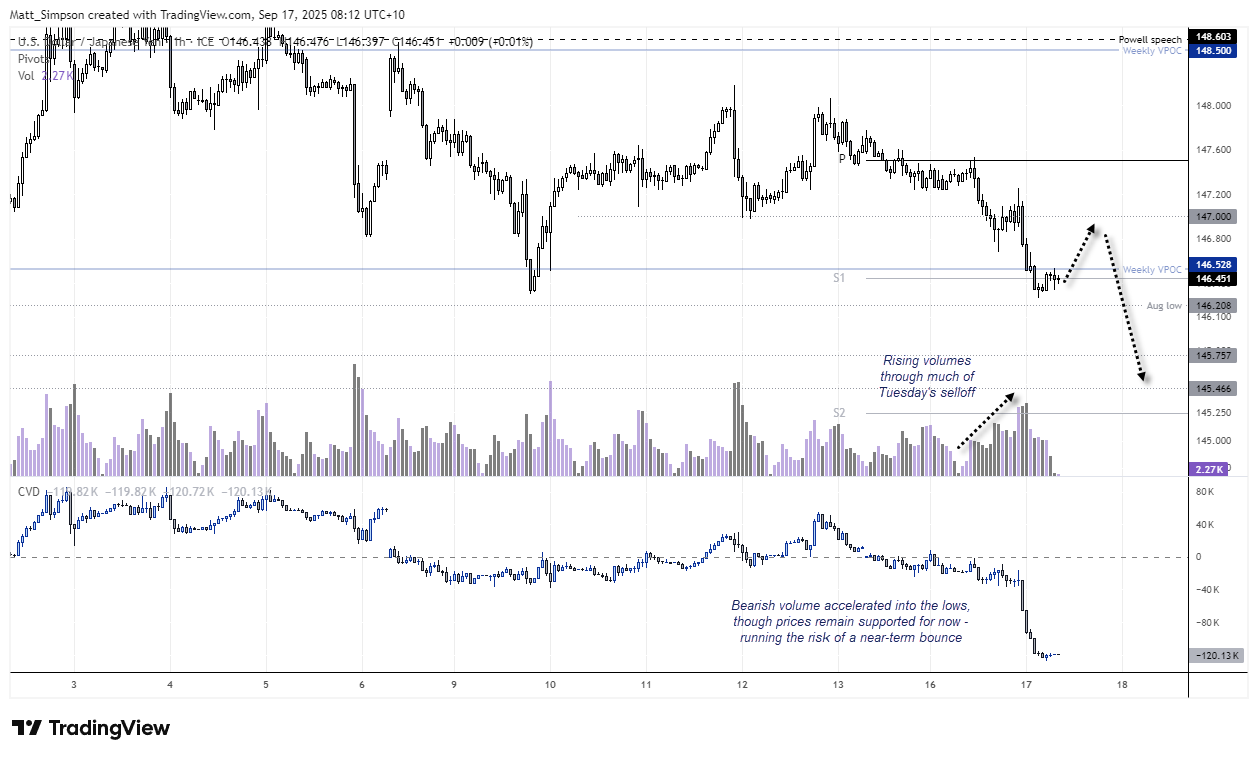
Chart analysis by Matt Simpson - data source: TradingView USD/JPY

EUR/JPY Technical Analysis: Euro vs Japanese Yen
The uptrend on the EUR/JPY daily chart appears on the cusp of its latest bullish breakout. Prices have printed a higher low along the 20-day EMA since breaking out of a correction channel in late August, and now close to breaking above the 174 handle and July high. The daily RSI (14) is confirming the bullish trend on EUR/JPY, though the daily RSI (2) is overbought which warns of near-term overextension to the upside. Even so, the uptrend is solid enough for bulls to lay in wait for any pullbacks within this week’s range in hope of a bargain, with their eyes likely on a move to the 2024 high around 174.40.
With the euro outperforming the US dollar and Japanese yen, it could bode well for EUR/USD bulls should the Fed deliver at least a vaguely dovish cut today.
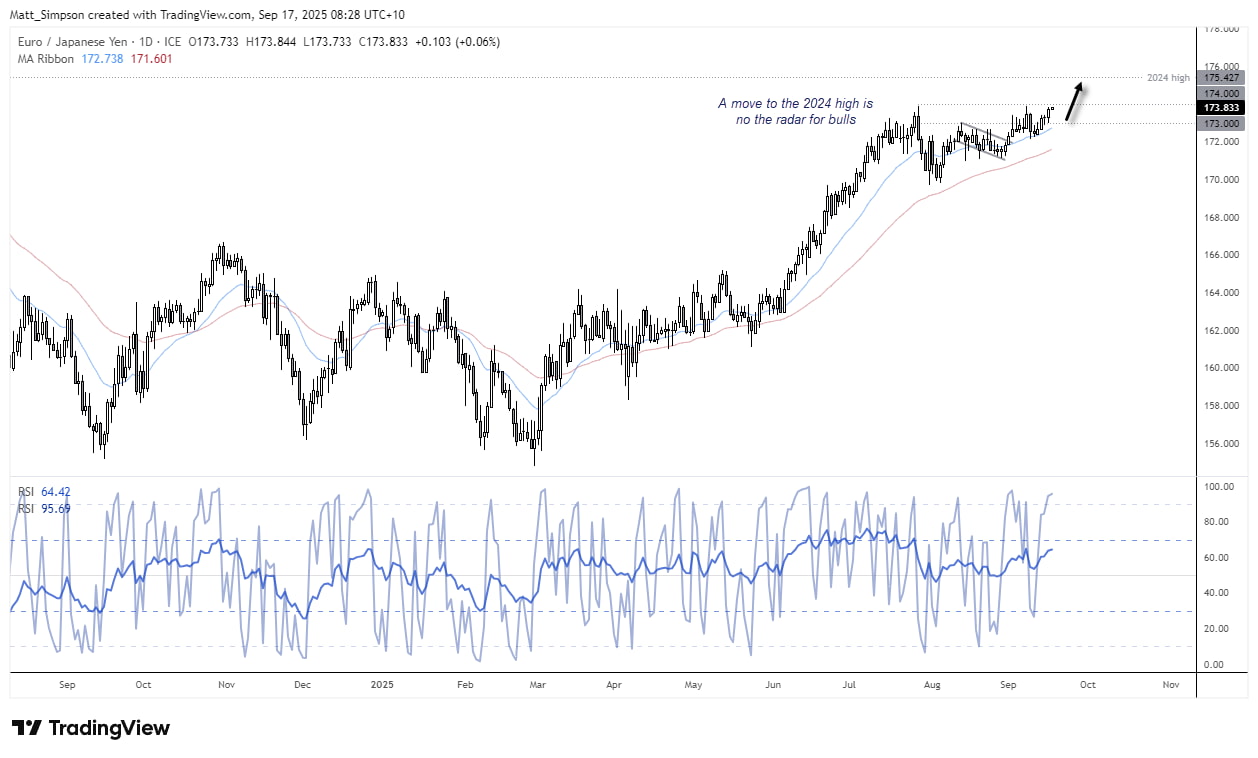
Chart analysis by Matt Simpson - data source: TradingView EUR/JPY
AUD/JPY Technical Analysis: Australian Dollar vs Japanese Yen
It appears some mean reversion is finally kicking in for the mighty AUD/JPY. The Australian dollar has risen over 4% in the past three weeks, mostly in a straight line. During which is managed to print its first 10-day winning streak in 11 years. And with the Bank of Japan (BOJ) meeting lingering, we could find that AUD/JPY bulls want to lighten their load and allow it to retrace a little more.
A bearish outside day formed on Tuesday, as part of a 3-day bearish reversal (evening star formation). A move back towards the July high (97.43) or HVN (97.22) appears to now be on the cards, a break beneath which brings the 96.76 HVN into focus.
But given the general strength of the bullish trend on AUD/JPY, such dips could be opportunities for bulls to rejoin this strong trend.
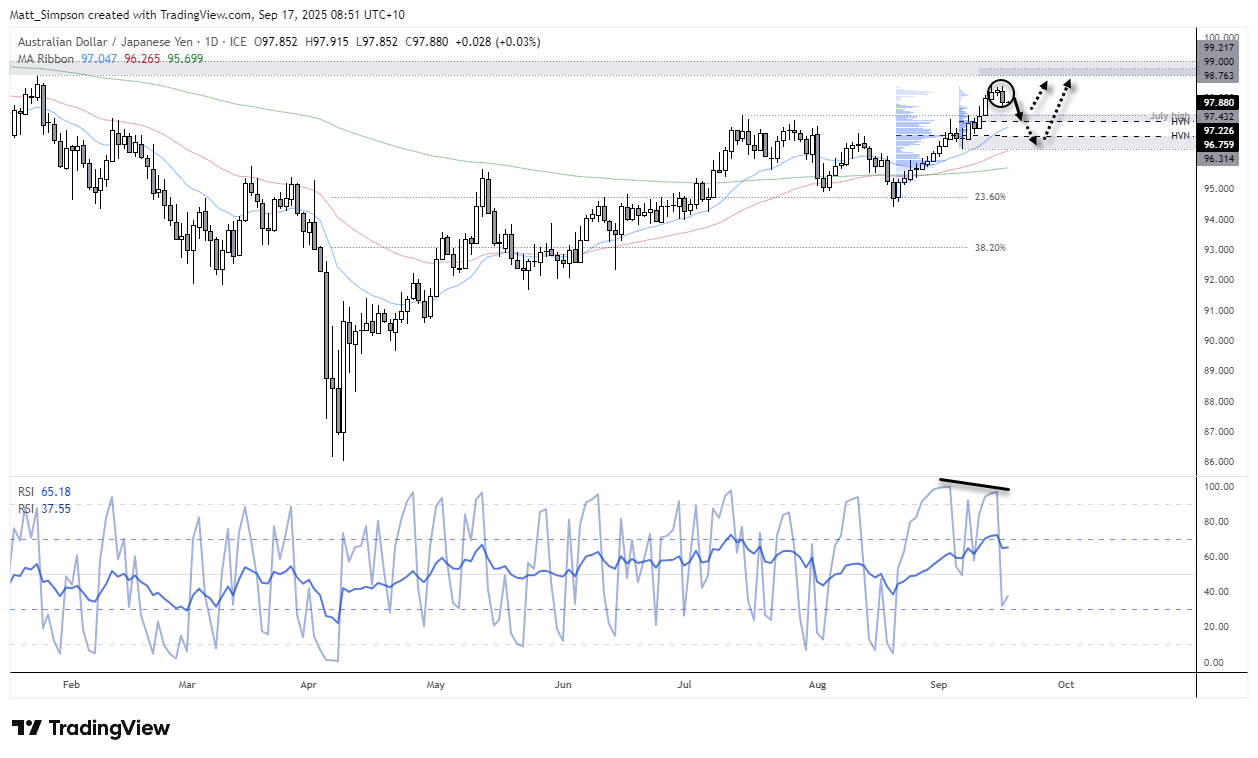
Chart analysis by Matt Simpson - data source: TradingView AUD/JPY
Key Economic Events for Traders (AEST / GMT+10)
08:45 NZD Current Account, Current Account % of GDP (Q2) (NZD/USD, AUD/NZD, NZD/JPY)
09:50 JPY Adjusted Trade Balance, Exports, Imports, Trade Balance (Aug) (USD/JPY, EUR/JPY, Nikkei 225)
10:00 AUD MI Leading Index (Aug) (AUD/USD, AUD/JPY, AUD/NZD)
10:30 SGD Non-Oil Exports (Aug) (USD/SGD, SGD/JPY, EUR/SGD)
11:30 AUD RBA Assistant Governor Jones Speaks (AUD/USD, AUD/JPY, AUD/NZD)
12:30 SGD Unemployment Rate (Q2) (USD/SGD, SGD/JPY, EUR/SGD)
16:00 GBP CPI, Core CPI, RPI, Core RPI, CPIH (Aug) (GBP/USD, EUR/GBP, FTSE 100)
17:30 EUR ECB President Lagarde Speaks (EUR/USD, EUR/GBP, DAX)
18:30 GBP House Price Index (Aug) (GBP/USD, EUR/GBP, GBP/JPY)
19:00 EUR CPI, Core CPI, HICP ex Energy & Food (Aug) (EUR/USD, EUR/GBP, DAX)
19:30 EUR German 30-Year Bund Auction (EUR/USD, EUR/GBP, DAX)
20:00 EUR German Buba Monthly Report (EUR/USD, EUR/GBP, DAX)
21:00 USD MBA Mortgage Market Data (Aug) (S&P 500, Nasdaq 100, USD/JPY)
22:00 CNY FDI (Aug) (USD/CNH, AUD/CNH, CNH/JPY)
22:30 USD Building Permits, Housing Starts (Aug) (S&P 500, Nasdaq 100, USD/JPY)
00:30 USD Crude Oil Inventories, Gasoline Inventories, Distillates, Cushing, Refinery Utilization (Weekly) (WTI Crude, Brent Crude, USD/CAD)
01:30 USD Atlanta Fed GDPNow (Q3) (S&P 500, Nasdaq 100, USD/JPY)
03:00 EUR German Buba President Nagel Speaks (EUR/USD, EUR/GBP, DAX)
04:00 USD FOMC Economic Projections, Statement, Fed Interest Rate Decision, Interest Rate Projections, FOMC Press Conference (S&P 500, Nasdaq 100, USD/JPY)