


The Japanese yen remains firmly in control this week, with USD/JPY sliding for a fourth straight day as weaker US jobs data fuel fresh expectations of a Fed rate cut. The yen’s strength has been reinforced by rising speculation of Bank of Japan (BOJ) tightening after two policymakers dissented at the latest meeting, while the Tankan survey showed resilience across manufacturing and services. With the dollar under pressure and the yen leading FX majors, traders are watching Friday’s Nonfarm Payrolls report for the next catalyst.
View related analysis:
- ASX 200 Morning Outlook: October Brings Bullish Bias and High Volatility
- Gold Outlook: Rising Implied Volatility on Path to $4000
- Australian Dollar Price Action Setups: AUD/USD, AUD/JPY, GBP/AUD
- Japanese Yen Price Action Setups: USD/JPY, AUD/JPY, GBP/JPY
USD/JPY Slides As Yen Strength Meets US Dollar Weakness
ADP Jobs Data Pressures the US Dollar
A weak ADP private payrolls report sparked fresh bets of a Fed cut, weighing on the US dollar and yields. The -32k print marked the fastest contraction since March 2023, while August’s figure was revised down sharply to -3.5k from 54k. However, some concerns were tempered after it emerged that missing September data inputs meant the calculations had a much “coarser granularity than in previous years”.
Even so, the employment trend is clearly weakening, helping set the tone for Friday’s Nonfarm Payrolls report. The US dollar clawed back some of its earlier ADP-driven losses but remains under pressure ahead of NFP.
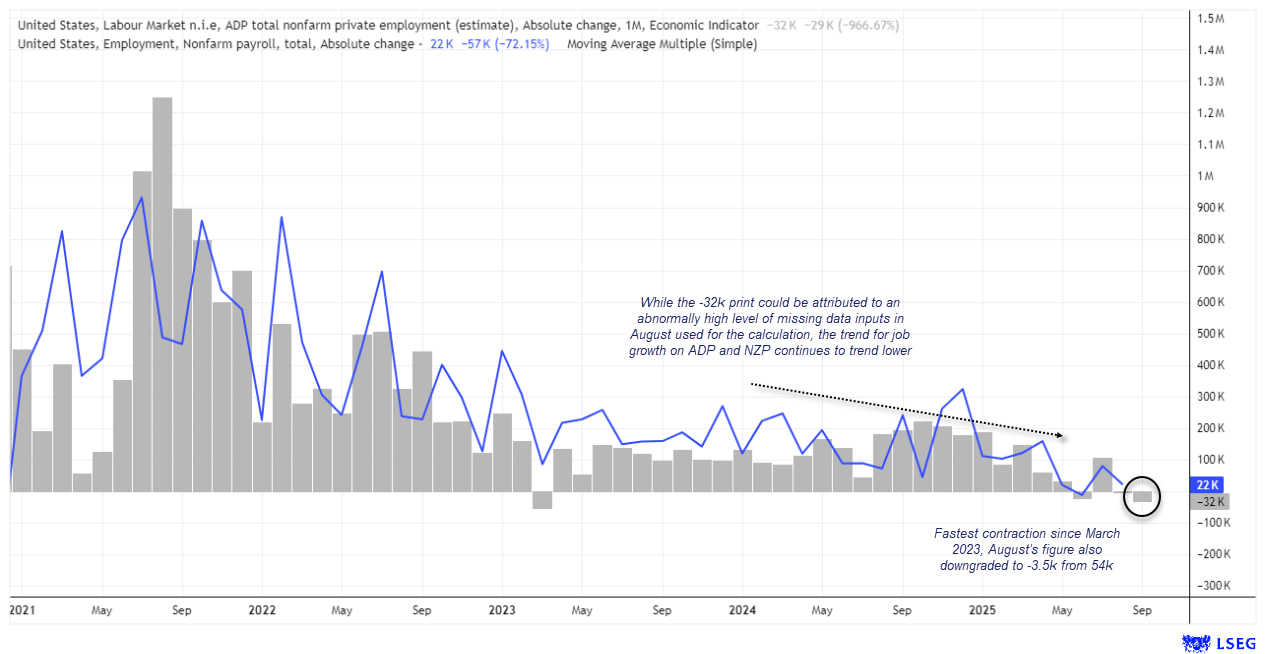
Chart prepared by Matt Simpson - data source: ADP, LSEG
BOJ Dissents Fuel Japanese Yen Rally
The Japanese yen has extended its rally this week on renewed expectations of Bank of Japan (BOJ) tightening. While the BOJ kept rates unchanged, two board members dissented, signalling growing appetite for policy shifts. The quarterly Tankan survey also highlighted resilience, with the large manufacturers’ index climbing to 14 and the services outlook reaching a four-decade high of 28.

Chart prepared by Matt Simpson - data source: Bank of Japan (BOJ)

Yen Outperforms Across FX Majors
The Japanese yen is currently the strongest FX major this week, while the US dollar is the weakest. USD/JPY has dropped -1.6% from Monday’s open, while CHF/JPY is down -1.9% from last week’s multi-year high. EUR/JPY is tracking a weekly bearish engulfing pattern, down -1.4%, and the Canadian dollar has fallen to a 13-week low against the yen. Even the Australian dollar has lost ground, with AUD/JPY turning lower after yesterday’s sharp selloff.
With the prospects of a BOJ hike returning alongside economic data potentially forcing the Fed’s dovish hand, I can revisit my earlier bias of a major high forming on USD/JPY.

Chart prepared by Matt Simpson - data source: LSEG
USD/JPY Weekly Technical Outlook: US Dollar vs Japanese Yen
The rally from the April low on the USD/JPY weekly chart continues to look corrective, pointing to an eventual move to fresh lows. A shooting star candle beneath the March high in late July signalled weakness, and USD/JPY now appears on track to form a lower high followed by a bearish engulfing week.
The 50-week SMA has acted as resistance since early July, capping momentum. Bears may look to fade minor rallies, with the September low at 145.48 as the first target. A break beneath this level exposes the 143.87 high-volume node (HVN). Should the corrective phase from the April low be complete, USD/JPY could trade below 138.50 in the coming weeks or months.
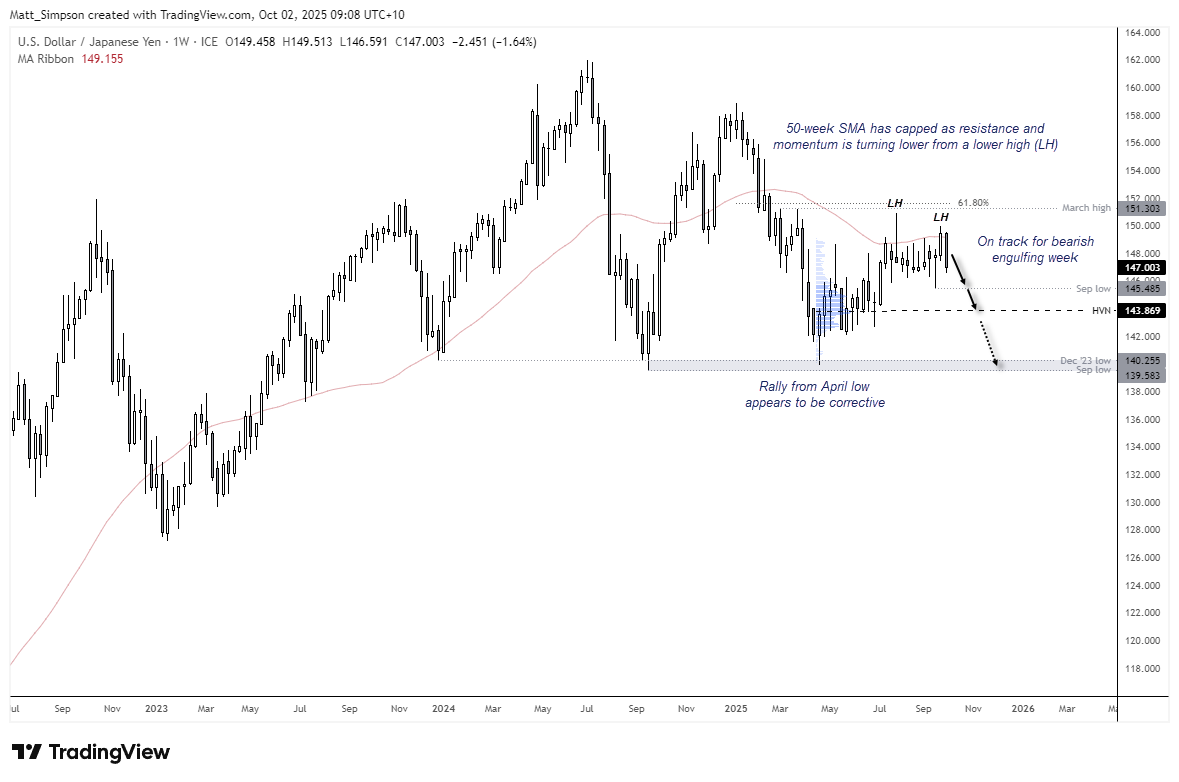
Chart analysis by Matt Simpson - data source: TradingView USD/JPY
USD/JPY Daily Levels To Watch
USD/JPY has now declined for a fourth consecutive day, with daily ranges expanding into the lows. This raises the risk of late sellers being caught short near support, suggesting bears may prefer to wait for a period of consolidation or a corrective bounce before re-engaging.
The 200-day EMA and the monthly pivot point sit just below the 148.00 handle, offering a potential resistance zone for sellers seeking more favourable entry levels.
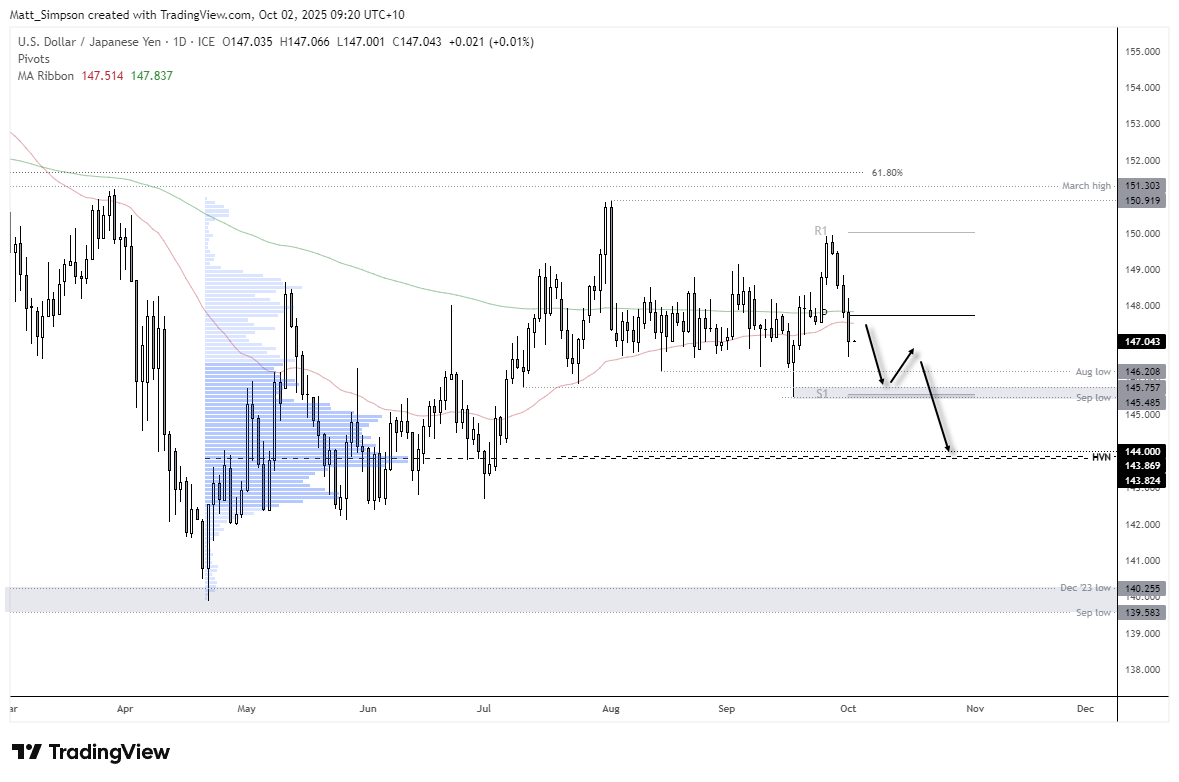
Chart analysis by Matt Simpson – Source: TradingView, USD/JPY

Key Economic Events for Traders (AEST / GMT+10)
09:50 JPY Foreign Bonds Buying, Foreign Investments in Japanese Stocks, Monetary Base (Sep) (USD/JPY, EUR/JPY, Nikkei 225)
11:30 AUD Exports, Imports, Trade Balance, RBA Financial Stability Review (Aug) (AUD/USD, AUD/JPY, AUD/NZD)
13:35 JPY 10-Year JGB Auction (USD/JPY, EUR/JPY, JGB futures)
15:00 JPY Household Confidence (Sep) (USD/JPY, EUR/JPY, Nikkei 225)
19:00 EUR Unemployment Rate (Aug) (EUR/USD, EUR/GBP, DAX)
21:30 USD Challenger Job Cuts (Sep, YoY) (S&P 500, Nasdaq 100, USD/JPY)
23:00 SGD S&P Global Manufacturing PMI (Sep) (USD/SGD, EUR/SGD, STI Index)
All Day CNY China National Day Holiday (USD/CNH, AUD/CNH, CN50 Index)
00:00 USD Durables Ex-Defense, Durables Ex-Transport, Factory Orders, Factory Orders Ex-Transport, Total Vehicle Sales (Aug/Sep) (S&P 500, Nasdaq 100, USD/JPY)
00:30 USD Fed Logan Speaks, Natural Gas Storage (WTI Crude, Henry Hub Gas, USD/CAD)
01:30 USD 4-Week Bill Auction, 8-Week Bill Auction (UST yields, USD/JPY, Nasdaq 100)
03:00 EUR ECB's De Guindos Speaks (EUR/USD, EUR/GBP, DAX)
View the full economic calendar
-- Written by Matt Simpson
Follow Matt on Twitter @cLeverEdge
How to trade with City Index
You can trade with City Index by following these four easy steps:
- Open an account, or log in if you’re already a customer
• Open an account in the UK
• Open an account in Australia
• Open an account in Singapore
- Search for the market you want to trade in our award-winning platform
- Choose your position and size, and your stop and limit levels
- Place the trade


