


The Japanese yen was the strongest FX major during a risk-off session on Tuesday, though the US dollar was not far behind. A sharp decline in Palantir’s stock despite a positive outlook, combined with warnings from the Goldman Sachs and Morgan Stanley CEOs that a pullback could be “healthy,” weighed heavily on Wall Street sentiment — ultimately prompting the very pullback they warned of.
Nasdaq 100 futures led Wall Street lower, falling 2% to a seven-day low in their worst session in more than three weeks. Palantir (PLTR) was the worst performer, dropping 9% from its record high and sliding below $200. The S&P 500 fell 1.1%, with eight of its 11 sectors declining, led by Information Technology (-2.5%) and Consumer Discretionary (-1.5%). The Philadelphia Semiconductor Index (SOX) dropped 3%, as traders grew concerned that the AI rally may be overextended.
While the yen was the preferred destination for risk-off flows among currency traders, the US dollar also regained some of its safe-haven appeal less than a week after the Fed delivered a relatively hawkish interest rate cut. Traders are also likely mindful of recent comments from Japan’s finance officials, who continue to watch the currency “very closely” in the hope that verbal intervention can stem volatility.
View related analysis:
- US Dollar Probes 6-Month High, AUD/USD Steady Into RBA
- The Nasdaq-to-Bitcoin Correlation Is Alive and Well (During Risk-Off)
- US Dollar Eyes Breakout as EUR/USD, GBP/USD Probe Support, USD/JPY Rallies
- Gold Shows Tentative Signs Of Stability, Options Hint At Mild Recovery
US Dollar Index (DXY) Technical Analysis
The US dollar index has closed above 100 for the first time in six months — though only slightly. The combination of a less-dovish Fed and safe-haven demand continues to shake dollar bears out of the tree, allowing the greenback to rise for a fifth consecutive day. My bias for a deeper wave C and a move closer to the May high remains in place, with the possibility of a rally towards the 138.2% Fibonacci extension near 101.50 still on the cards.
Still, the marginal close above 100, alongside a fifth-day high, could warrant at least some caution around current levels. However, momentum remains clearly behind the dollar’s bullish camp, and dips seem more likely to be bought than sold for now.
Once wave C is complete, I anticipate momentum will realign with the broader bearish move from the January high to the June low.

Chart analysis by Matt Simpson - data source: TradingView U.S. Dollar Index Futures

Japanese Yen (JPY) Technical Analysis
Yen pairs were lower across the board, even against the mighty US dollar. The performance of the major currencies against the yen serves as a useful lesson in relative strength.
- The New Zealand dollar led the declines, with NZD/JPY falling 1.3% in its worst session in 17 days. The RBNZ retains a dovish bias, making the Kiwi dollar more sensitive to risk-off flows than usual. The cross printed a firm daily close beneath its 200-day EMA — a level bears may look to fade into should it be retested.
- The Australian dollar could have fallen further were it not for the relatively hawkish RBA meeting on Tuesday, where policymakers held rates as expected and trimmed their forecasts to allow for just one 25 bp cut in 2026. AUD/JPY fell 1.1% and closed back below 100, though support has been found around its 20-day EMA for now.
- The Swiss franc weakened against the yen for a third straight day, with CHF/JPY dropping below 190 and extending its decline from the record high to 1.7%.
- A bearish outside day formed on USD/JPY as the yen found slightly more appeal than the US dollar for safe-haven flows. However, its broader bullish trend remains intact and could still attract dip-buyers.
- EUR/JPY fell beneath its prior swing low on the daily chart, warning of a potential trend change — or at least the start of a three-wave corrective move, of which this would presumably be the first wave. That said, it appears to be attempting a recovery back above the 20-day EMA in the near term.
- GBP/JPY saw a firm daily close beneath its 50-day EMA — a level bears could look to fade into should it retrace far enough.

Chart analysis by Matt Simpson - data source: TradingView

USD/JPY Technical Analysis: US Dollar vs Japanese Yen
The bearish outside day on USD/JPY has spoiled the bullish trend over the near term, though not yet reversed it — for that, prices would need to break below the 151.53 swing low. Still, USD/JPY appears stretched from its 10- and 20-day EMAs, while a bearish divergence has formed on the daily RSI (2), suggesting some mean reversion could be due.
The October high at 153.28 is likely a pivotal level for traders in the short term, made more significant by its alignment with the weekly pivot point. The 1-hour chart shows prices attempting to hold above that level for now.
The bias is for a break beneath the October low once the current consolidation or retracement on the 1-hour timeframe completes. Bears may look to fade into moves toward the 154 handle or high-volume node in anticipation of a pullback to the 20-day EMA near 152.
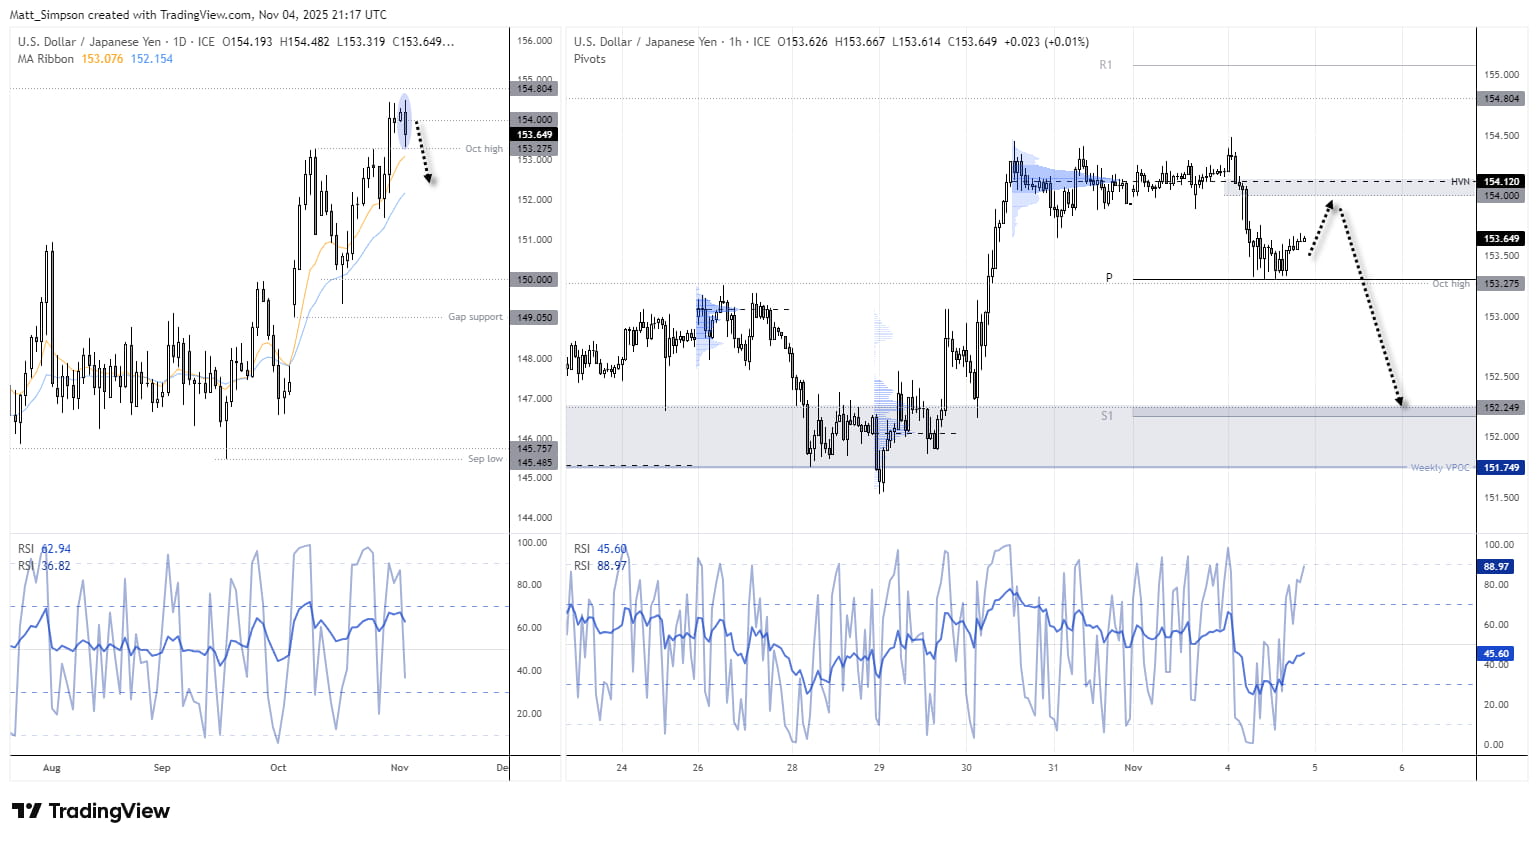
Chart analysis by Matt Simpson - data source: TradingView USD/JPY
View the full economic calendar
-- Written by Matt Simpson
Follow Matt on Twitter @cLeverEdge
How to trade with City Index
You can trade with City Index by following these four easy steps:
- Open an account, or log in if you’re already a customer
• Open an account in the UK
• Open an account in Australia
• Open an account in Singapore
- Search for the market you want to trade in our award-winning platform
- Choose your position and size, and your stop and limit levels
- Place the trade


