


Traders are eagerly awaiting Friday’s US PCE inflation data, which could determine whether the Federal Reserve cuts rates in September and leaves scope for another in December. The risk, however, is that PCE prints hot — echoing recent CPI strength — which would likely support the US dollar. Until then, USD/JPY price action is expected to remain range-bound.
View related analysis:
- Australian Dollar Outlook: Dip Buyers to Circle The Aussie
- Japanese Yen Outlook: BOJ Hike Talk Builds as USD/JPY Eyes 149
- Gold, Silver, Crude Oil Outlook: Technical Analysis, Market Positioning
USD/JPY Technical Analysis: US Dollar vs Japanese Yen – Weekly Chart
The weekly chart shows USD/JPY grinding higher within a choppy uptrend, which looks corrective against the broader decline from the January high to the April low. A prominent shooting star candle beneath the March high suggests the corrective rally may be nearing an end.
While momentum points higher in the short term, a hot PCE print could provide another push upwards. My bias, however, is for price to remain capped beneath that shooting star high. The reasoning:
- The Bank of Japan (BOJ) is edging closer to another rate hike.
- The Fed remains under pressure to cut rates.
- Futures positioning looks increasingly favourable for Japanese yen bulls, signalling downside risks for USD/JPY.

Chart analysis by Matt Simpson - data source: TradingView USD/JPY
JPY/USD Positioning: Japanese Yen Futures – Weekly COT Report
The latest Commitment of Traders (COT) report suggests Japanese yen bulls may be returning. While net-long exposure has trended lower since April, it is starting to stabilise. Large speculators are gently increasing gross-longs while trimming shorts, allowing net-long exposure to turn slightly higher.
This shift indicates sentiment is no longer at a bearish extreme, leaving room for the yen to appreciate and send USD/JPY lower in the weeks ahead.

Chart analysis by Matt Simpson - data source: CME, LSEG
USD/JPY Technical Analysis: US Dollar vs Japanese Yen – Daily Chart
What makes the daily chart on USD/JPY so interesting is how its recent range highs and lows have been ricocheting between two weekly VPOCs (volume points of control). While there was a brief intraday break above the 148.50 VPOC on Friday, the elongated bearish outside day suggests USD/JPY is not yet ready for a bullish breakout. With the high-to-low range marking its most bearish daily volatility since the larger engulfing candle on August 1, it indicates that bears may look to fade rallies within the range.
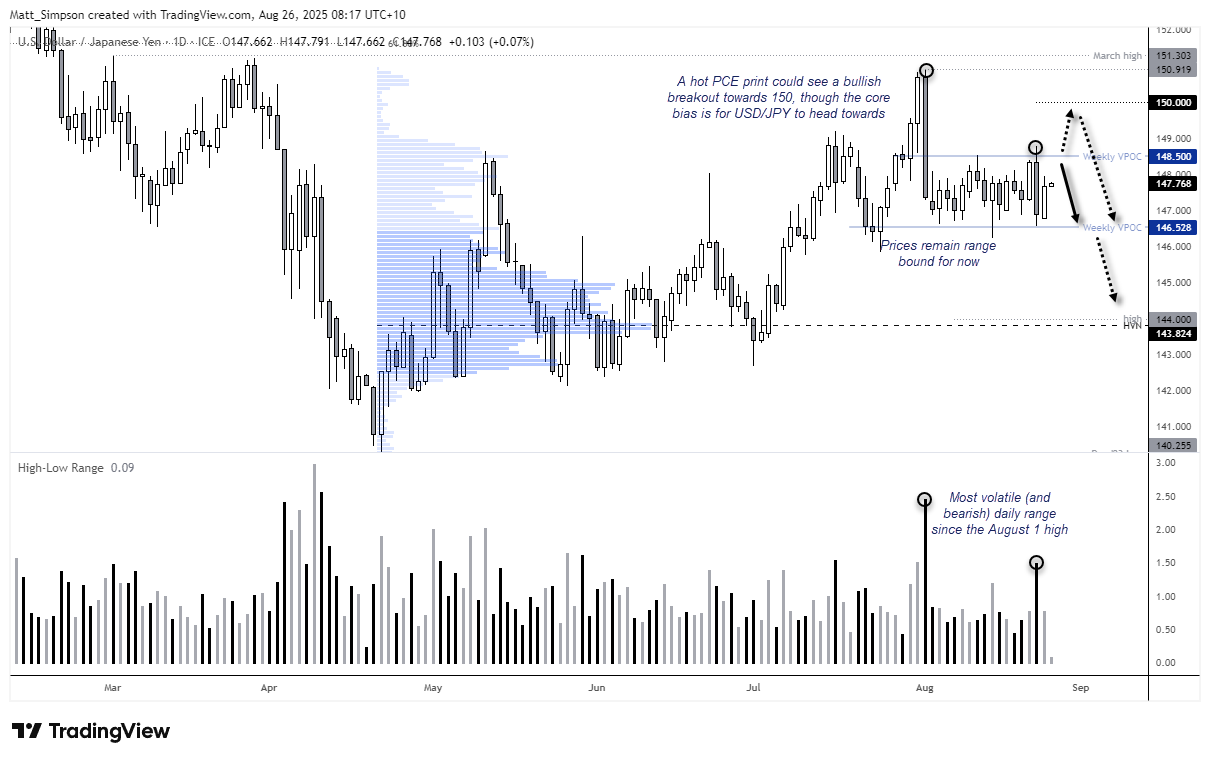
Chart analysis by Matt Simpson - data source: TradingView USD/JPY
USD/JPY Technical Analysis: US Dollar vs Japanese Yen – 1-Hour Chart
The 1-hour chart highlights USD/JPY’s sharp downside volatility during Jerome Powell’s Jackson Hole speech. Current price action appears corrective, suggesting bears may be waiting to fade into resistance zones.
Two key resistance areas stand out: the monthly pivot (148.07) to the weekly R1 pivot (148.26), and the weekly VPOC (148.50) up to the Jackson Hole high at 148.60. Bears could look for signs of a swing high within these levels, targeting the weekly pivot at 147.40. A break beneath this pivot would expose range lows around the 146.50 VPOC.
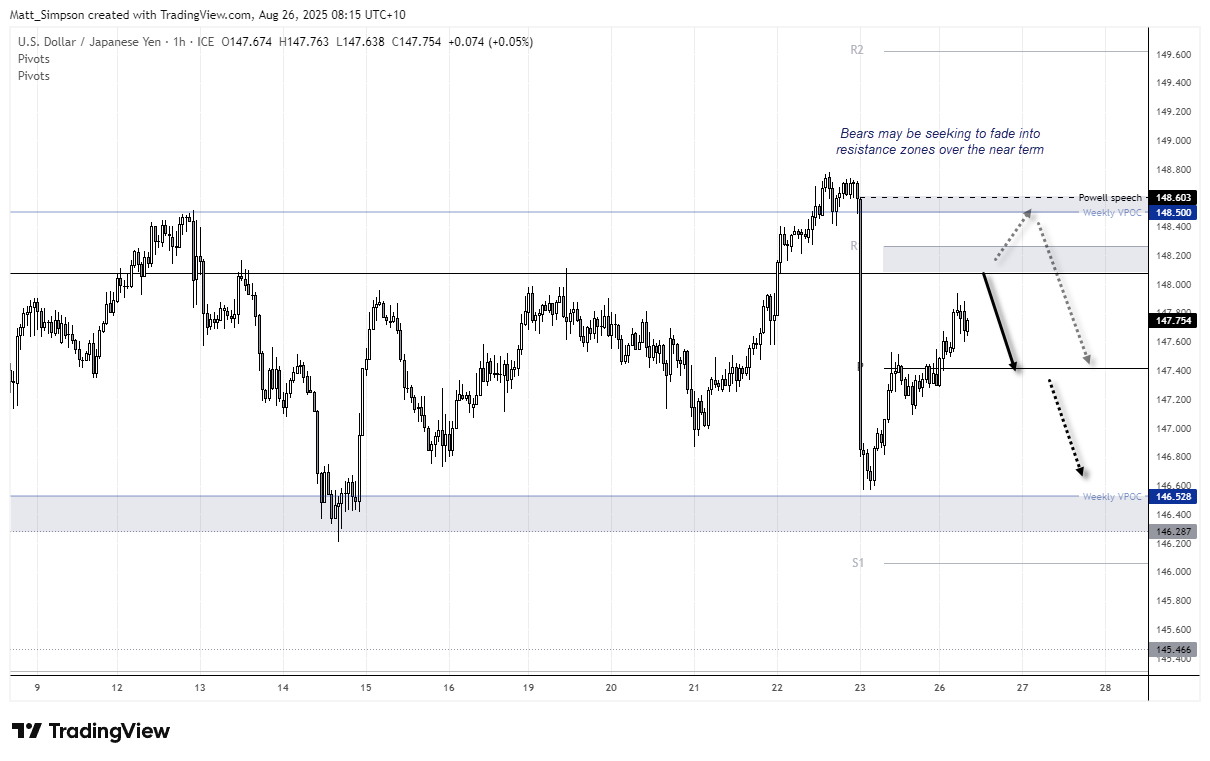
Chart analysis by Matt Simpson - data source: TradingView USD/JPY
Key Economic Events for Traders (AEST / GMT+10)
09:01 GBP BRC Shop Price Index (Jul) (GBP/USD, EUR/GBP, GBP/JPY)
09:15 USD FOMC Member Williams Speaks (S&P 500, Nasdaq 100, USD/JPY)
09:50 JPY Corporate Services Price Index (Jul) (USD/JPY, EUR/JPY, AUD/JPY)
11:30 AUD RBA Meeting Minutes (AUD/USD, AUD/JPY, AUD/NZD)
15:00 JPY BoJ Core CPI (Jul) (USD/JPY, EUR/JPY, AUD/JPY)
15:00 SGD Industrial Production (Jul) (USD/SGD, EUR/SGD, SGD/JPY)
16:45 EUR French Consumer Confidence (Aug) (EUR/USD, EUR/GBP, DAX)
22:30 USD Durable Goods, FOMC Member Barkin Speaks (S&P 500, Nasdaq 100, USD/JPY)
22:55 USD Redbook (S&P 500, Nasdaq 100, USD/JPY)
23:00 USD House Price Index (Jun), S&P/CS HPI Composite - 20 (Jun) (S&P 500, Nasdaq 100, USD/JPY)
23:00 CAD Manufacturing Sales (Jul) (USD/CAD, EUR/CAD, CAD/JPY)
00:00 USD CB Consumer Confidence (Aug), Richmond Manufacturing Index (Aug), Richmond Manufacturing Shipments (Aug), Richmond Services Index (Aug) (S&P 500, Nasdaq 100, USD/JPY)
00:30 USD Dallas Fed Services Revenues (Aug), Texas Services Sector Outlook (Aug) (S&P 500, Nasdaq 100, USD/JPY)
01:30 USD Atlanta Fed GDPNow (Q3) (S&P 500, Nasdaq 100, USD/JPY)
02:00 GBP BoE MPC Member Mann Speaks (GBP/USD, EUR/GBP, GBP/JPY)
03:00 USD 2-Year Note Auction (S&P 500, Nasdaq 100, USD/JPY)
04:30 CAD BoC Gov Macklem Speaks (USD/CAD, EUR/CAD, CAD/JPY)
06:30 USD API Weekly Crude Oil Stock, M2 Money Supply (Jul) (WTI Crude, Brent Crude, USD/JPY)


