
USD/JPY is showing signs of fatigue after stalling at the key 160 resistance level, with bearish divergence hinting at a potential pullback. At the same time, Nikkei 225 futures are building a constructive base above 50k, supported by the prospect of a stronger Japanese yen.
While geopolitical risks could inject volatility and trigger whipsaw price action in the near term, the technical setups across both markets point to a possible shift in momentum—USD/JPY lower and Nikkei higher.
View related analysis:
- AUD/USD Outlook: Trump Address Could Trigger Breakout or Breakdown
- US Dollar Outlook: Bearish April Seasonality Meets Middle East Wildcard
- FX Futures Positioning: US Dollar, EUR/USD, USD/JPY | COT report
USD/JPY Technical Analysis: US Dollar vs Japanese Yen
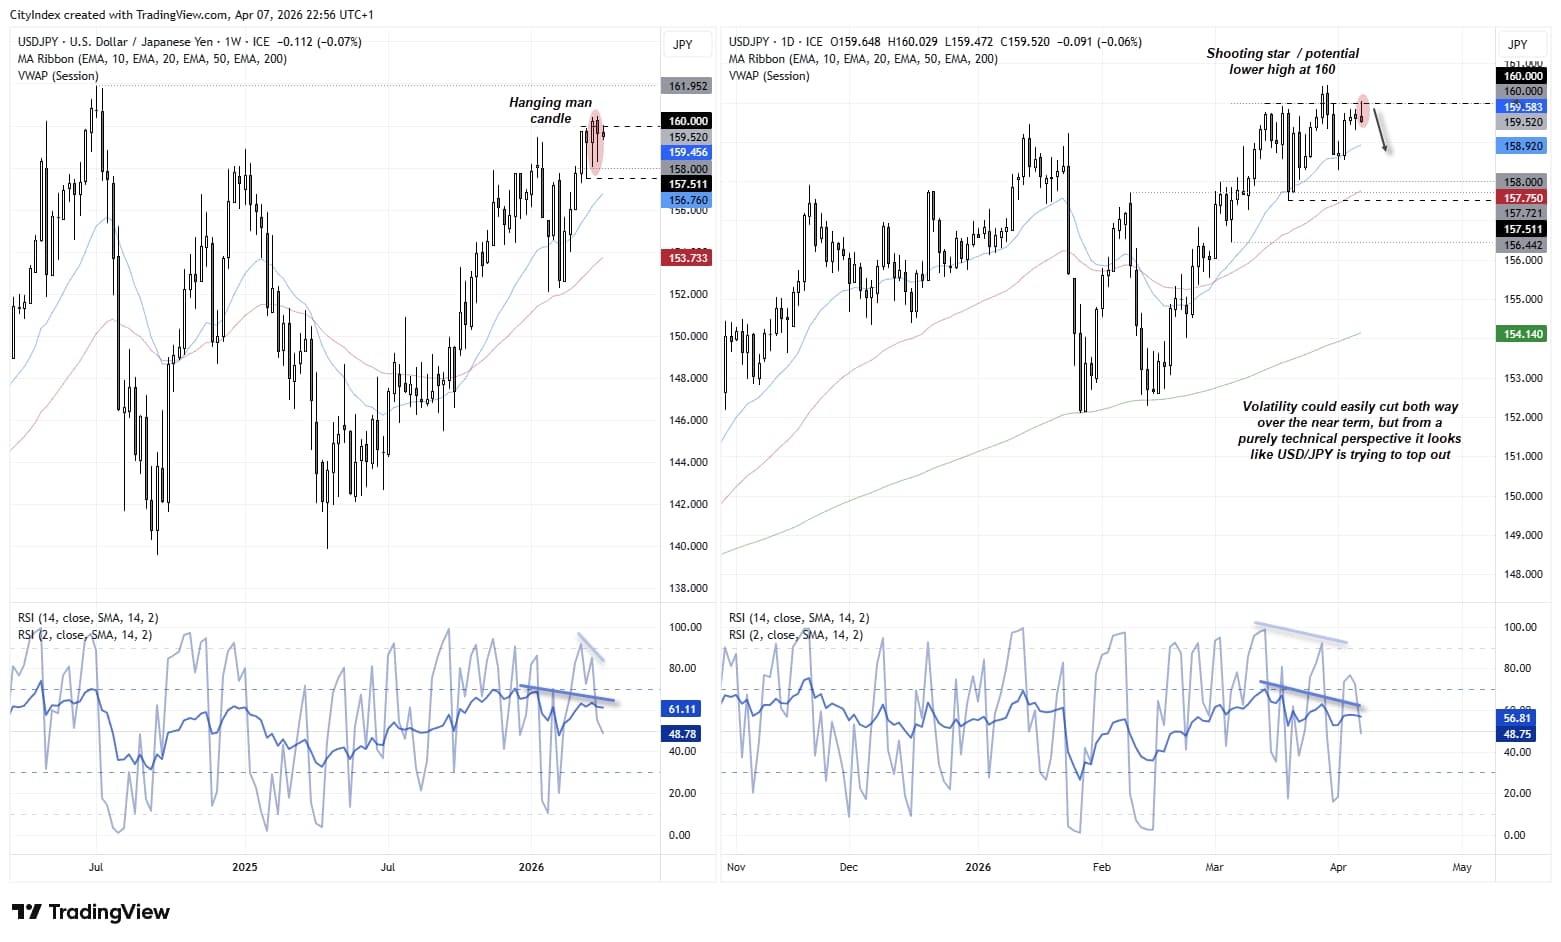
USD/JPY Rejection at 160 Signals Potential Lower High
A small shooting star candle formed on Tuesday, but what makes it more significant is that it tested – and respected – 160 as resistance. This leaves the potential for a lower high to form at a key level for traders, even if it only signals some mean reversion towards the 20-day EMA just below 159.
Note the bearish divergence on both RSI (14) and RSI (2) heading into the March high, which warned of a potential top. And with the weekly chart showing an elongated hanging man candle last week, we may need to be on guard for some Japanese yen strength and US dollar weakness, which could see USD/JPY fall from current levels.

Geopolitics and Volatility Risks Could Drive Whipsaw Moves
Of course, such a move assumes positive developments on the Iran situation. While we hope that proves to be the case, traders should also be prepared for two-way volatility in the near term, which could lead to whipsaw price action before the real move unfolds. But from a purely technical perspective, my bias is for the downside over the near term.
Source: ICE, TradingView
Nikkei 225 Futures (NK) Technical Analysis
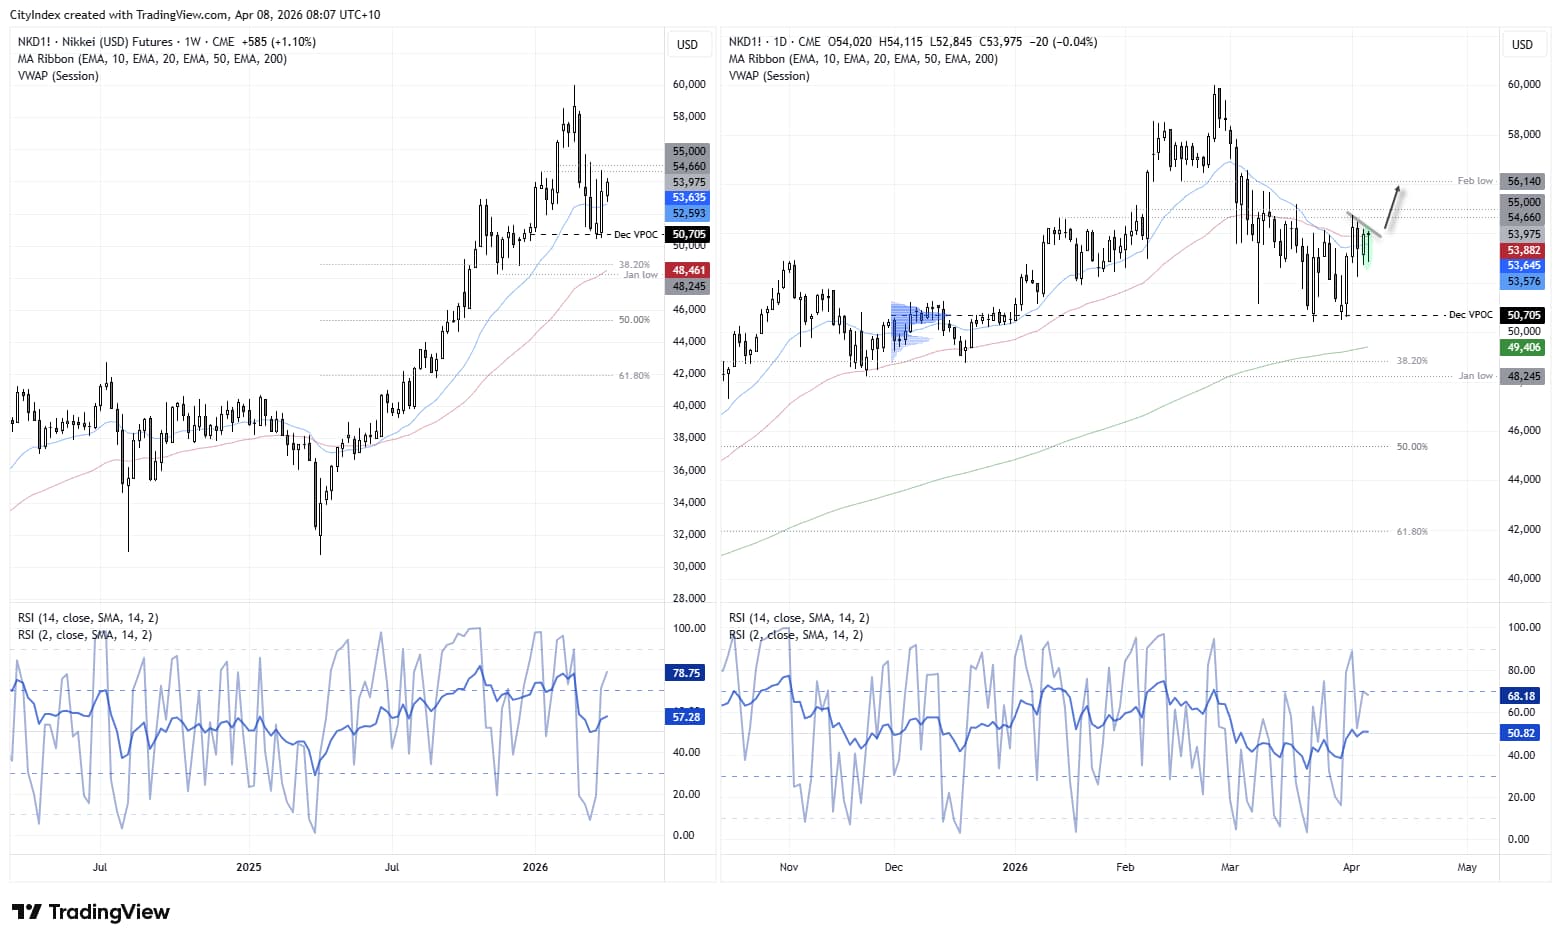
Nikkei 225 Builds Bullish Structure Above 50k
If the Japanese yen strengthens and sends USD/JPY lower, this could be bullish for the Nikkei in the near term. That is what the charts appear to be hinting at, even if the setup remains vulnerable to some nasty whipsaws.
The Nikkei futures chart shows a double bottom forming above 50k before bulls drove a three-day rally last week. While resistance was met just below 55k, the pullback has been shallow, and price action points to the potential formation of a bull flag. Also, note the bullish pinbar on Tuesday which shows demand within this week’s range and a desire for prices to break higher.
55k Break Key to Unlock Further Upside
For now, my bias remains bullish while prices hold above Thursday’s low (52,230), with a break above 55k the key upside trigger.
Source: CME, TradingView
View the full economic calendar
-- Written by Matt Simpson
Follow Matt on Twitter @cLeverEdge
How to trade with City Index
You can trade with City Index by following these four easy steps:
- Open an account, or log in if you’re already a customer
• Open an account in the UK
• Open an account in Australia
• Open an account in Singapore
- Search for the market you want to trade in our award-winning platform
- Choose your position and size, and your stop and limit levels
- Place the trade