
- Yen strength and Japan curve behaviour remain central
- Carry unwind risks rising alongside fragile risk sentiment
- US data unlikely to dominate without major surprises
- Price action around 152 looms as the key battleground
Summary
USD/JPY starts the week on unstable footing as strengthening yen flows, fragile risk sentiment and rising pressure on carry positions collide. With traditional macro drivers offering only limited clarity, traders may need to look elsewhere for direction. Recent market behaviour provides an important guide.
Curve Signals Matter Again
In the week ahead, few scheduled events genuinely stand out as having the power to shift USD/JPY’s trajectory. Instead, Japan’s bond market and broader risk appetite look set to remain the dominant themes traders need to stay across.
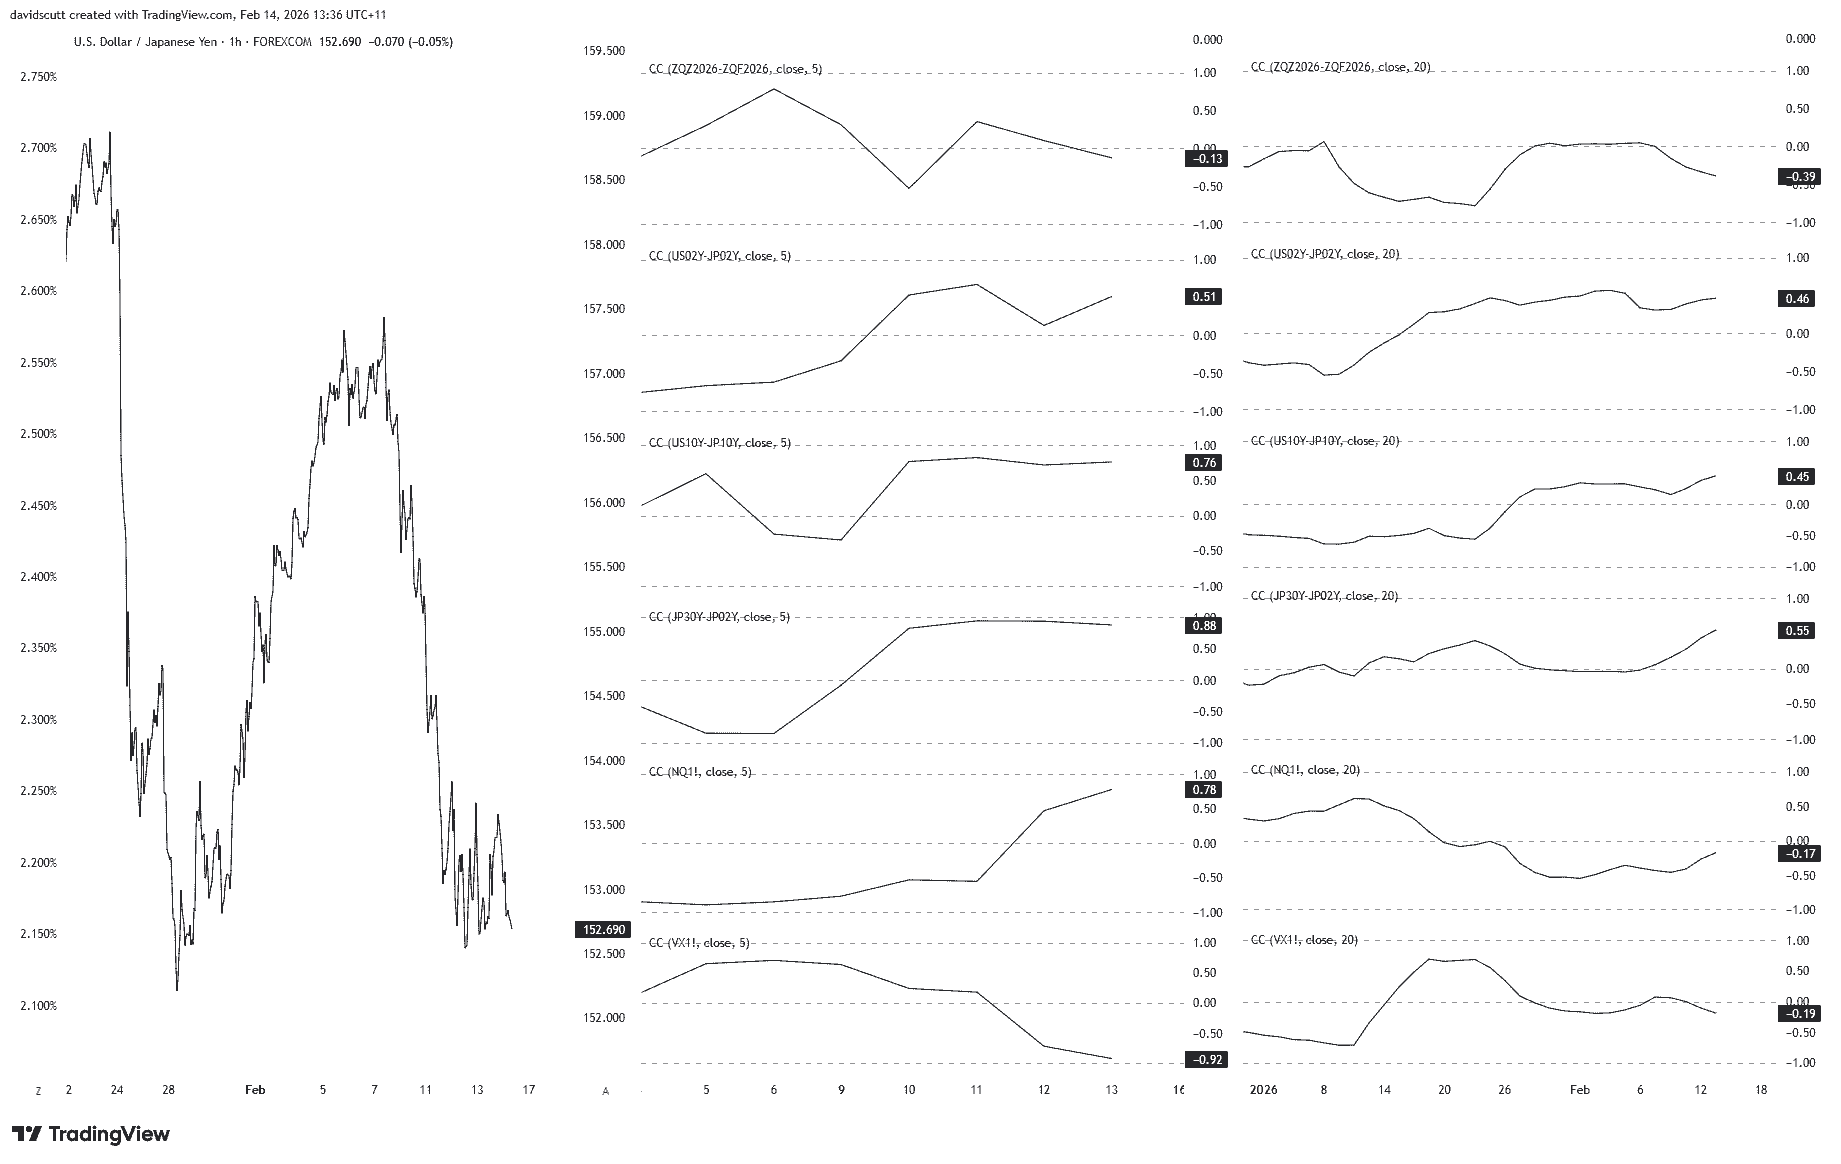
That view is reinforced by the graphic below. From left to right, it shows USD/JPY on the hourly timeframe, the rolling five-day correlation coefficient scores against a range of market indicators, and the corresponding 20-day correlations on the right. From top to bottom, the comparisons run through 2026 Fed rate cut pricing derived from futures, US-Japan two-year yield spreads, 10-year spreads, Japan’s 2s30s curve, Nasdaq futures, and VIX futures.
Source: TradingView
What stands out most is that over the short and medium-term, USD/JPY has become increasingly correlated with the shape of Japan’s 2s30s curve. The five-day correlation sits at 0.88, while the 20-day measure, at 0.55, has strengthened noticeably even if still not overly strong.
As discussed in separate analysis last week, this suggests easing concerns about Japan’s fiscal outlook have been a factor supporting the yen’s recent rally, reflecting a likely reversal of the pre-emptive selloff seen before the Japanese election amid expectations of increased JGB issuance. The relationship appears linked rather than spurious, meaning any fiscal policy announcements from the Japanese government could prove influential not only for the shape of the JGB curve but also directional risks in USD/JPY from a fundamental perspective.
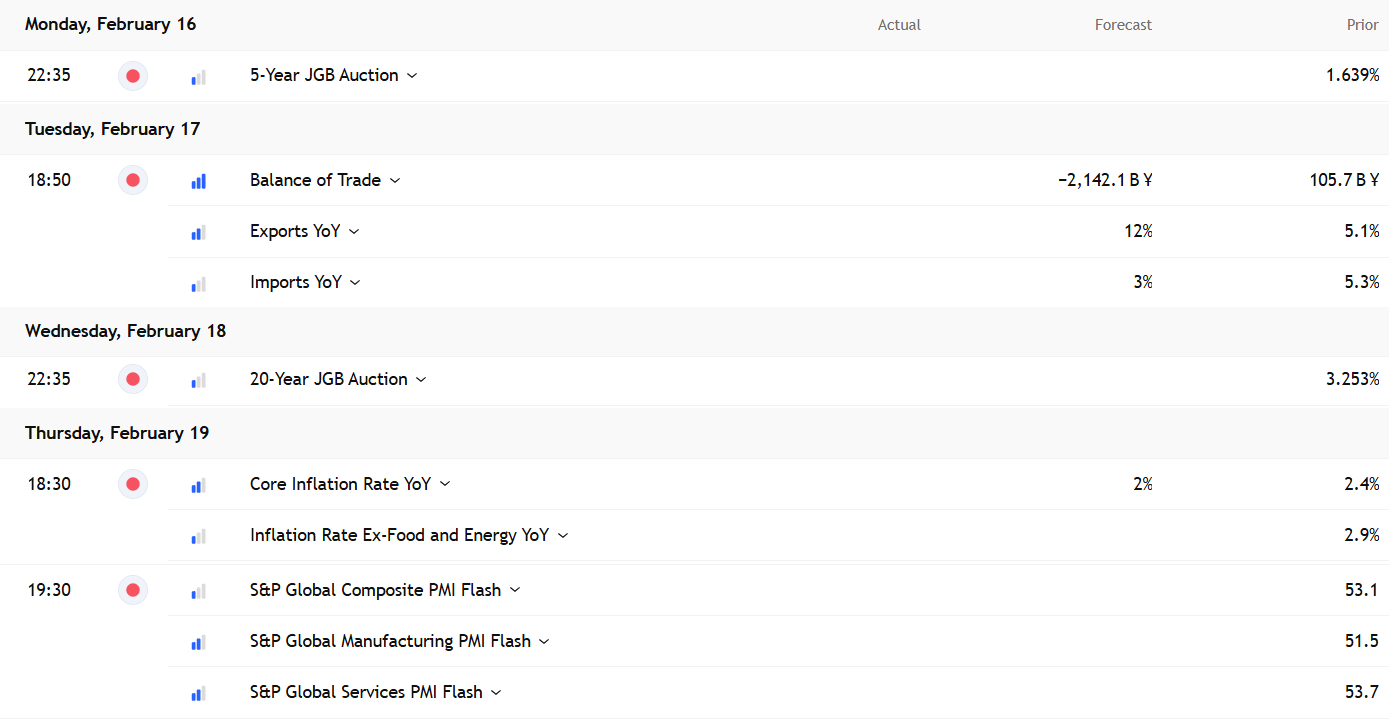
A fresh auction of 20-year JGBs during the week is therefore another event worth monitoring.
Carry Trade Risks Back in Focus
The other major risk worth flagging is the growing potential for a disorderly unwind of carry positioning in USD/JPY. The combination of rising short-term borrowing costs in Japan, a strengthening yen and wobbling risk assets creates a backdrop that is far from benign. Weakness across areas that had previously acted as market leaders, including crypto, precious metals and, more recently, US technology stocks, only adds to this vulnerability.
With carry positions already under pressure, any sustained decline in asset prices could easily trigger a snowball effect as traders are forced to cover. While the macro backdrop differs, the last comparable episode was seen in August 2024, when a weaker-than-expected payrolls report sparked a decline of more than 10 big figures in USD/JPY.
Recent correlation patterns only reinforce that risk. USD/JPY has posted a 0.78 correlation coefficient with Nasdaq futures over the past week, alongside a striking -0.92 relationship with VIX futures. The direction of travel across all three markets should be setting off alarm bells.
While still nowhere near the levels seen for extended periods in the past, there has also been a modest strengthening in the relationship between US-Japan yield differentials over both the short and longer-term over the past week, particularly the latter where the correlation coefficient with 10-year spreads sits at 0.76. This suggests there may still be scope for the economic events calendar to capture traders’ attention, even if few releases appear especially influential for directional risks.
Busy Calendar, Limited Catalysts
Source: TradingView
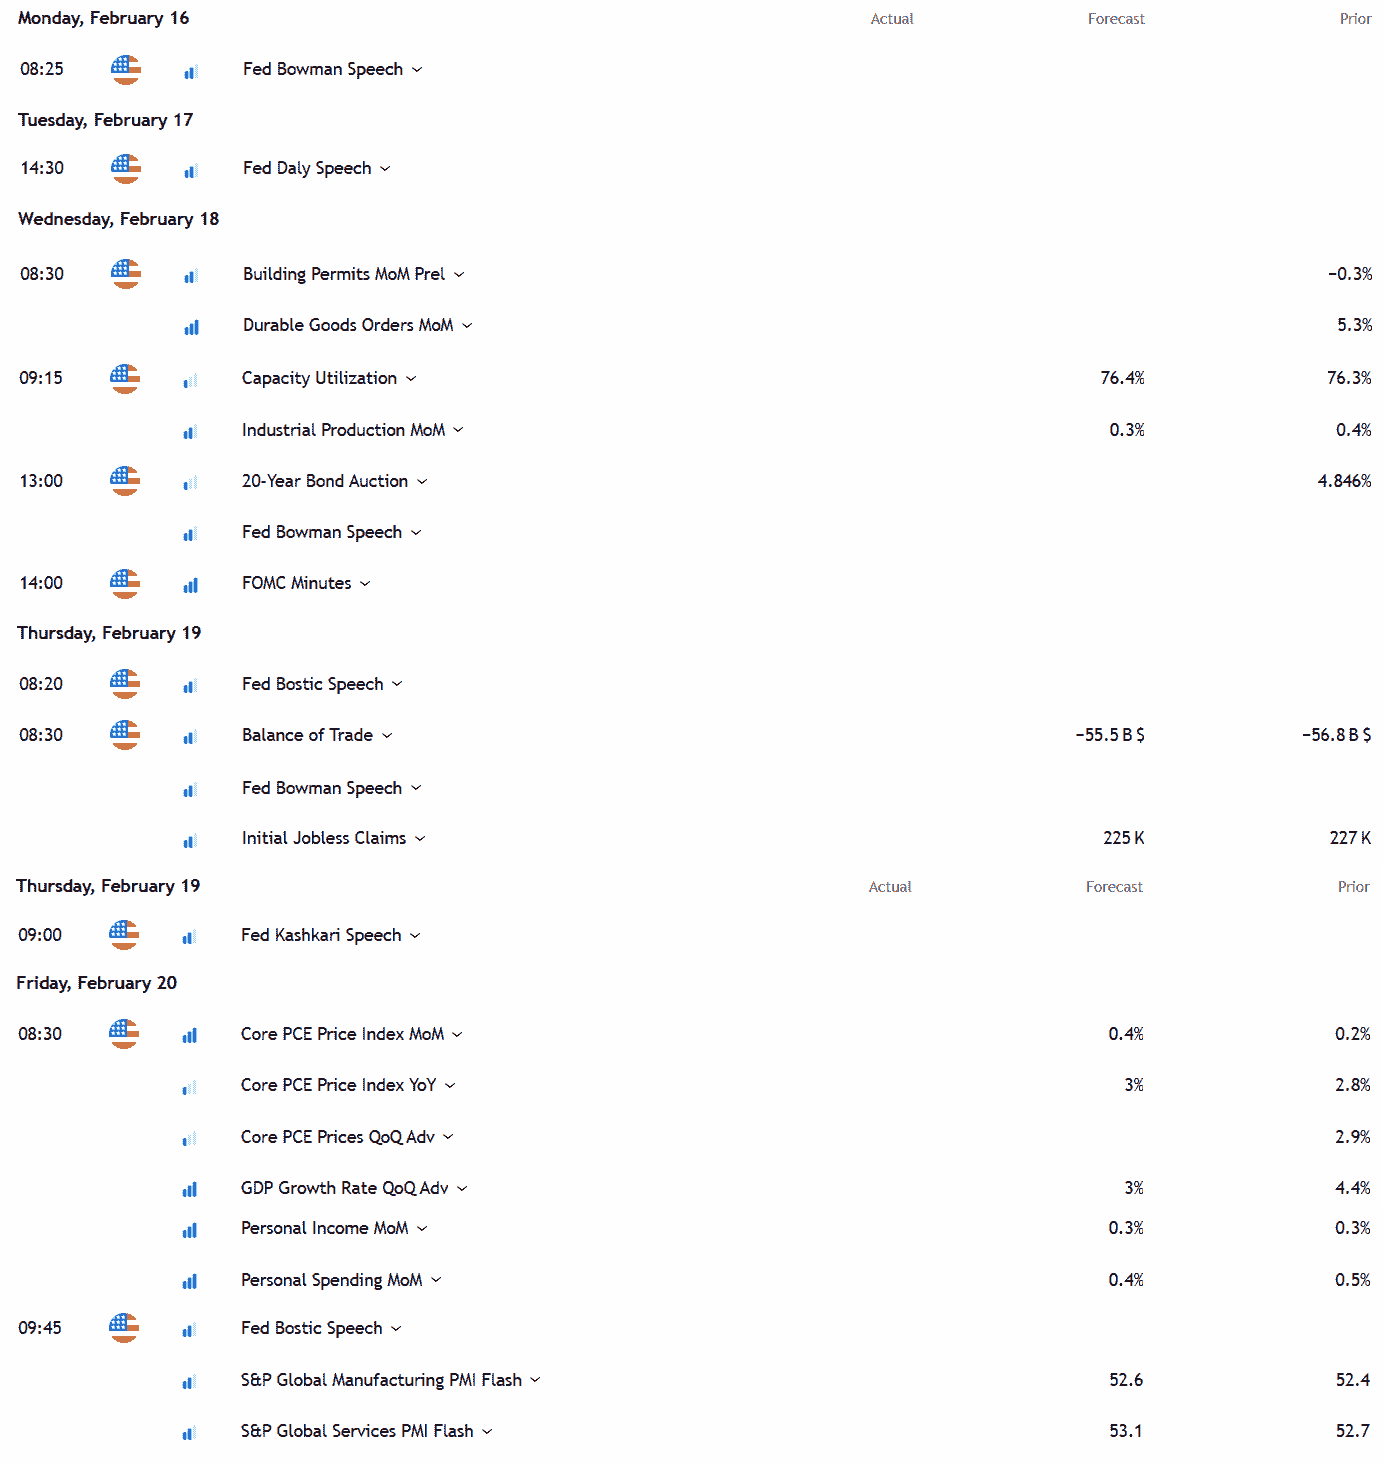
While the Core PCE deflator warrants attention as the Fed’s preferred underlying inflation measure, economists have become increasingly adept at mapping its likely outcome based on CPI and PPI data released beforehand. As a result, it arguably poses little threat to markets unless we see a genuinely shocking deviation from consensus.
Realistically, there may be just as much interest in the incomes and spending components within the report, given their importance in helping to underpin economic growth, particularly following the weakness seen in December retail sales. With the advanced Q4 GDP report released at the same time, and flash PMIs arriving just over an hour later, Friday looms as a credible volatility event.
Adding to that potential, a US Supreme Court ruling on the legality of Trump’s reciprocal tariffs may also arrive around 10am Eastern time that day. Should the decision go against the government, and no alternative legal avenues be provided to collect the tariffs, it could trigger a rise in longer-dated US Treasury yields and weigh heavily on the dollar, creating a possible catalyst for a broader carry unwind.
Before the late-week crescendo, traders should also keep an eye on comments from Fed officials following last week’s key jobs and inflation data. Jobless claims and the FOMC minutes are the other events that may offer opportunities for trade entry and exit points.
Inflation Data Loses Its Punch
Source: TradingView
By comparison, Japan’s calendar looks thin, bordering on a nothingburger outside of the 20-year JGB auction. While national inflation data is released on Friday, the report has largely lost its market-moving impact since Tokyo CPI began arriving several weeks earlier. As a result, it rarely delivers a meaningful surprise, let alone one capable of generating a sustained market reaction.
152 Emerges as the Battleground
Source: TradingView
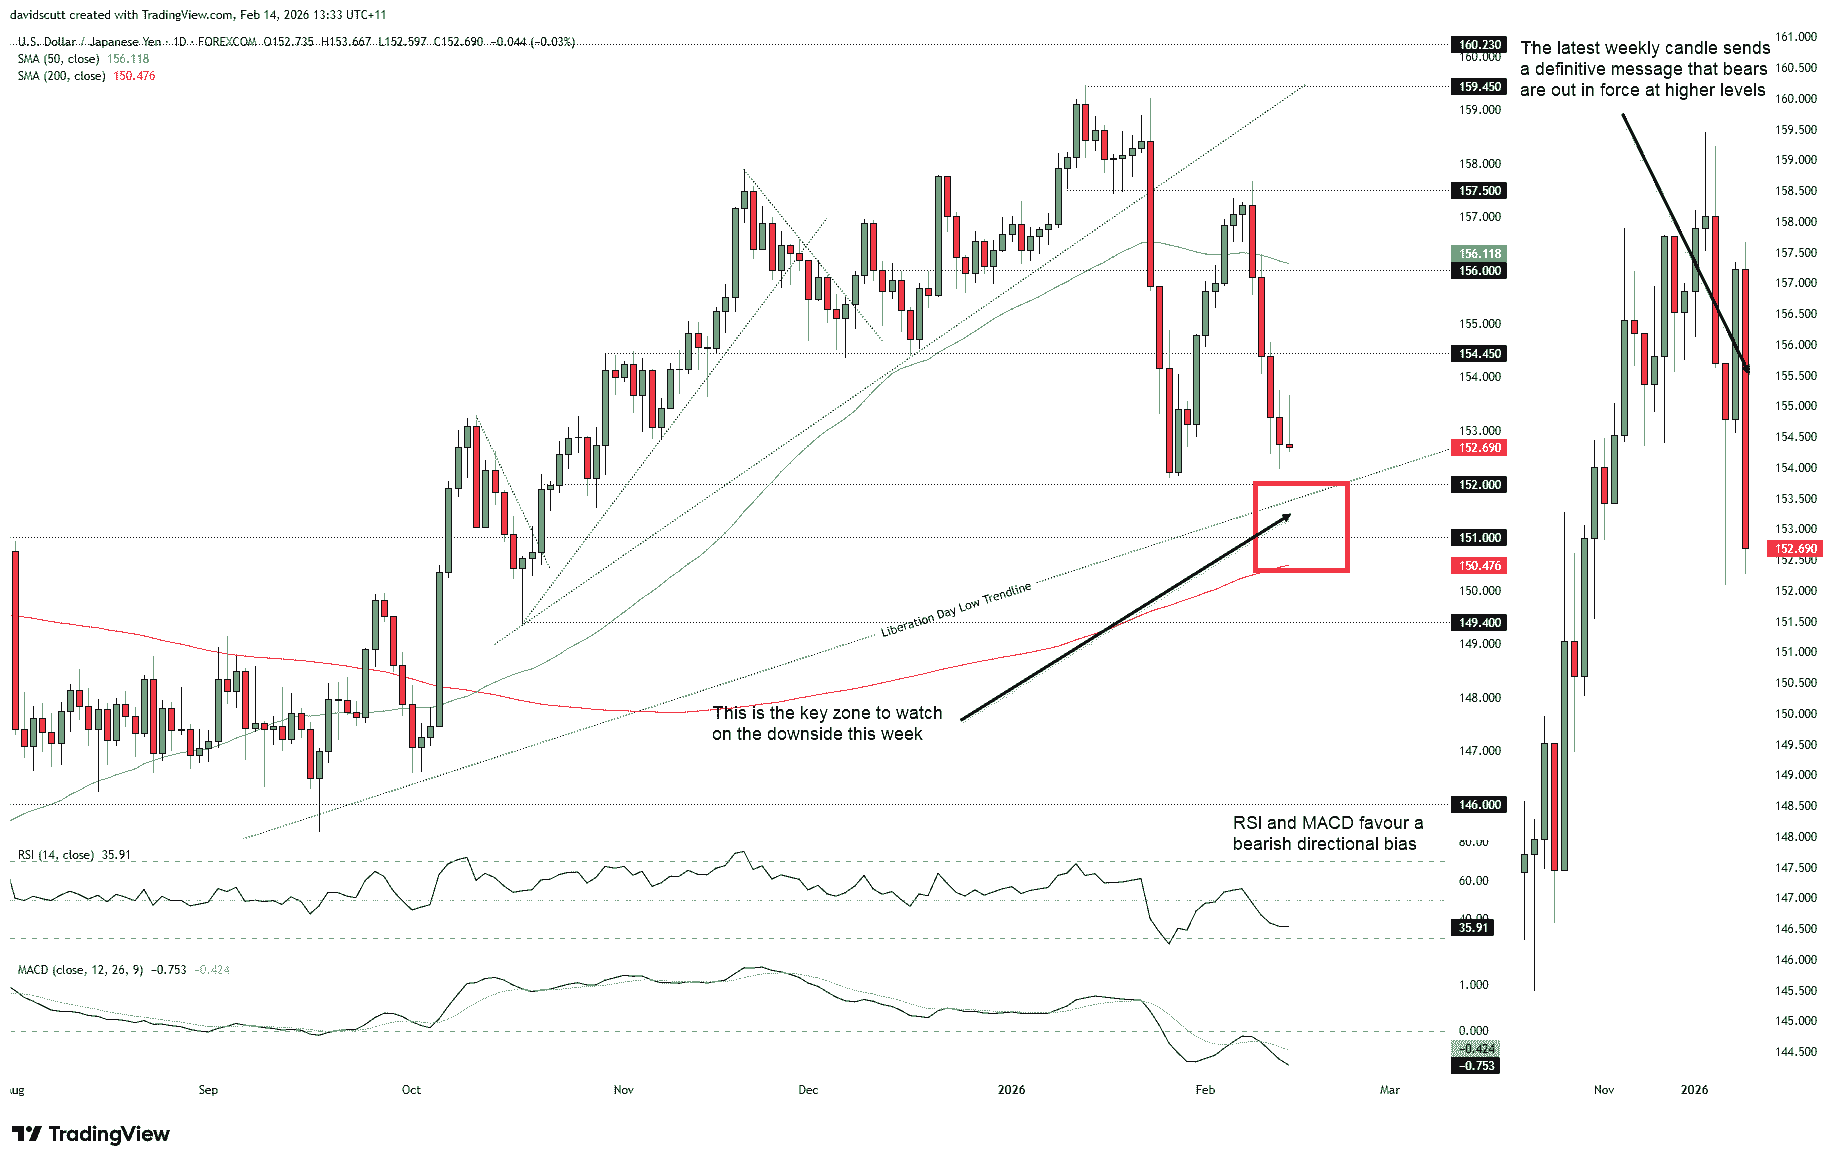
The dominant technical signal comes from last week’s weekly candle, which printed a sizeable bearish key reversal. While the bullish engulfing pattern seen the week prior proved to be a false signal, and the latest bearish reversal did not emerge after a prolonged rally, its sheer size still delivers a meaningful warning that sellers are becoming more aggressive.
Momentum indicators on the daily timeframe reinforce that message. RSI (14) and MACD continue to lean bearish, favouring short setups over longs. The last two daily candles also suggest selling into strength, with pronounced topside wicks indicating rallies are attracting additional supply rather than sustained buying interest.
For those looking at potential trade structure, rallies may continue to attract selling interest above 153.50, where the last two daily candles stalled, and again near former support at 154.45.
However, confidence in a sustained downside move likely requires a decisive break of the broader support zone clustered around 152, the April 2025 uptrend, 151 and 200DMA. Dips towards the January swing low of 152.10 found willing buyers last week, hinting that a more pronounced breakdown may prove difficult without a meaningful fundamental catalyst.
Price action around 152 therefore looms as a key focal point in the week ahead. Should that area give way, the risk of forced carry trade unwinds may increase substantially.
While the broader tone remains heavy, a sustained move back above the 50DMA would begin to weaken the near-term bearish bias, forcing a reassessment of downside conviction.