


The US dollar selloff showed signs of stabilising on Monday as traders weighed a mixed ISM services report and fresh political headlines tied to the Federal Reserve. While the PMI print barely held above contraction, inflation pressures surged—complicating the Fed's path. Meanwhile, markets continue to price in a September rate cut, with Trump signalling he may nominate a dovish Fed candidate—one who could also be considered for Fed Chair. The dollar’s rebound has stalled near key technical levels, leaving traders to assess whether recent gains were corrective or a top is in.
View related analysis:
- US Dollar Rally at Risk as Fed's Waller Fuels Dovish Pivot Speculation
- Gold Futures Outlook: Technical Triangle Meets COT Pressure
- Dow Jones Futures (YM) Outlook: August Seasonality and Key Levels
- AUD/JPY, CAD/JPY and ASX 200 Technical Setups: Key Levels in Focus
ISM Inflation Rises, Trump Fuels Fed Speculation, DXY Tests Support
The US services sector barely expanded in July, according to the latest ISM non-manufacturing survey. The headline services PMI printed at 50.1, narrowly avoiding contraction after May's 49.9. It remains well below its 12-month average of 52.3 and the October 2023 peak of 55.8.
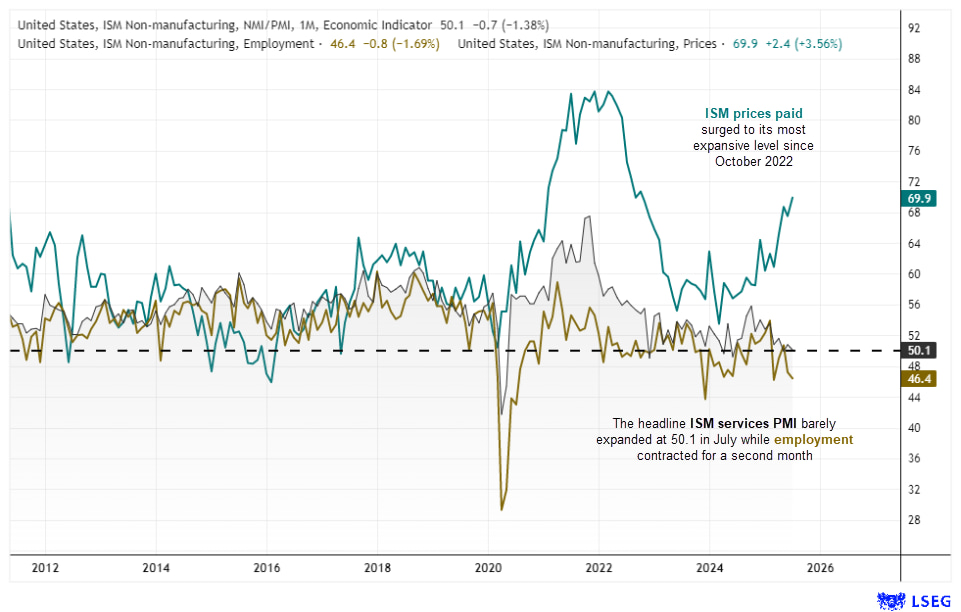
Chart prepared by Matt Simpson - data source: ISM, LSEG
- Business activity expanded at a slower pace of 52.6 (down from 54.2)
- New orders softened to 50.3.
- Employment contracted for a second straight month, falling to 46.4
- Backlog of orders contracted for a fifth and rose to 44.3 from 42.4, which indicates demand continues to falter.
- Export orders also contracted, presumably as tariffs dented demand from overseas partners.
The standout figure was inflation: the prices paid index jumped to 69.9, its highest level since October 2022. A striking 15 of 18 industries reported higher prices in July, showing inflation in the services sector remains persistent.

Fed Fund Futures Favour Cuts, Trump Eyes Fed Vacancy
Despite the weak growth outlook, Fed Fund Futures (FFF) continue to assign a high probability (92.9%) to a rate cut in September. However, markets have pared back expectations from three cuts to two in 2025, with the next likely 25bp cut priced for October at 58.6%.
Friday’s weaker-than-expected non-farm payrolls (NFP) report triggered a sharp drop in the US dollar and Treasury yields, as traders renewed bets on easier Fed policy.
Meanwhile, political developments are also in play. Former President Donald Trump announced a shortlist of four candidates to replace Adriana Kugler on the Fed’s Board of Governors, stating he would decide “by the end of the week”. He added that his nominee could also be considered for Fed Chair.
This puts Christopher Waller in focus, given his vocal support for rate cuts in July—making him a potential replacement for Jerome Powell should Trump win re-election.
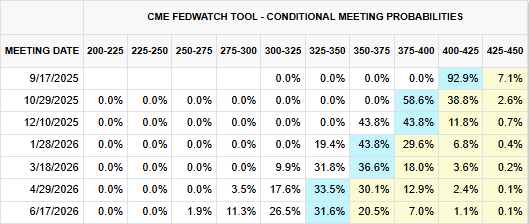
Chart prepared by Matt Simpson – data source: CME
US Dollar Index (DXY) Technical Analysis
The US Dollar Index has been grinding higher in a corrective fashion since the June low and managed to tag the 100 handle during its most bullish week since November, closing with a strong bullish engulfing candle.
However, with Trump signalling plans to appoint dovish-leaning candidates to the Fed and US data showing signs of weakness, I remain sceptical that the dollar has much upside left.
The daily chart shows a prominent bearish engulfing candle formed near 100 following Friday’s weak NFP report, potentially marking a significant swing high. Still, price is consolidating in a tight range above the 10-day EMA and 20-day EMA, leaving the door open for a minor bounce before any further downside.
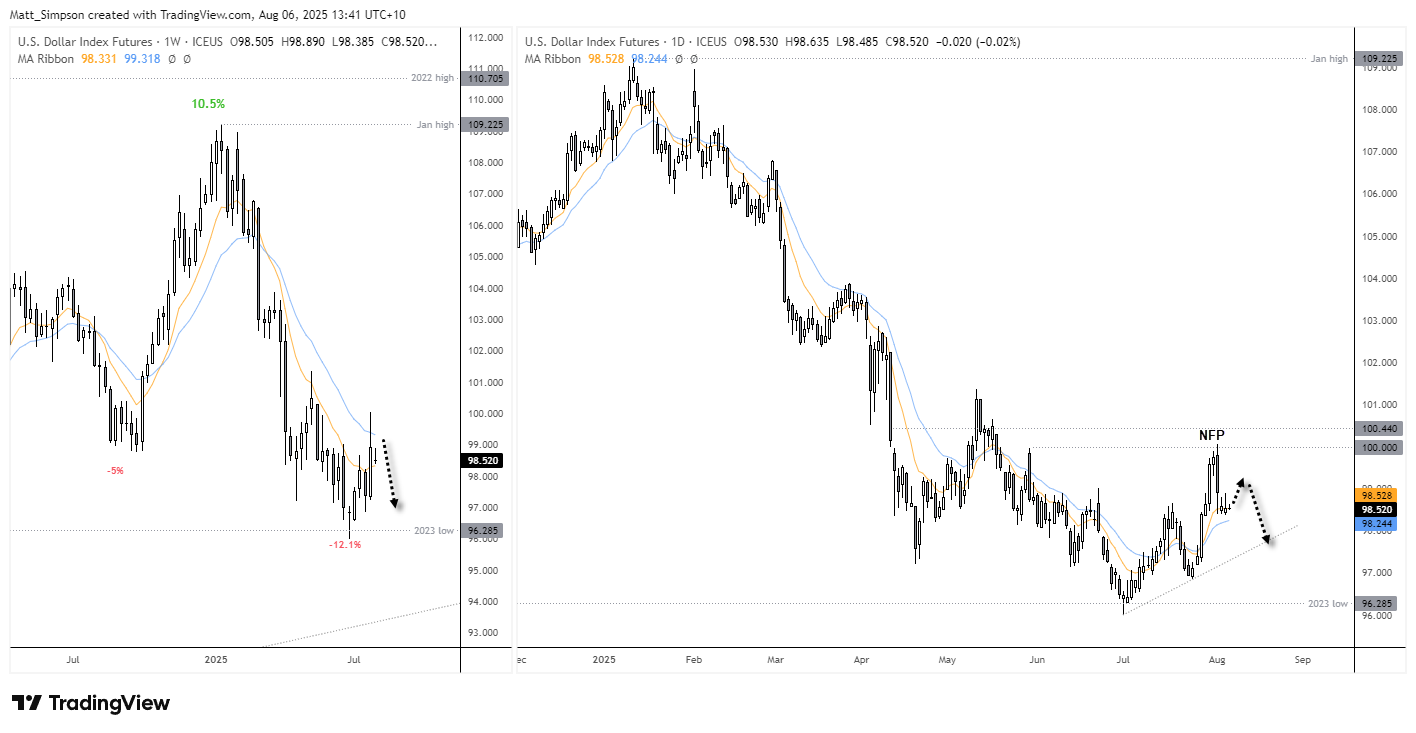
Chart analysis by Matt Simpson - Source: TradingView, US dollar index (DX1!)
View the full economic calendar
-- Written by Matt Simpson
Follow Matt on Twitter @cLeverEdge
How to trade with City Index
You can trade with City Index by following these four easy steps:
- Open an account, or log in if you’re already a customer
• Open an account in the UK
• Open an account in Australia
• Open an account in Singapore
- Search for the market you want to trade in our award-winning platform
- Choose your position and size, and your stop and limit levels
- Place the trade


