
As 2026 continues to unfold, currencies across North America are beginning to show notable shifts compared to the price action seen earlier in the year. Heading into Q2 2026, both USD/CAD and USD/MXN face a landscape shaped by changes in monetary policy, uncertainty around economic growth, and rising geopolitical tensions in the Middle East. In this context, both the Canadian dollar and the Mexican peso have started to lose ground against a strengthening U.S. dollar, and this trend could gain further traction if confidence in the greenback holds in the coming months. If this dynamic persists, both USD/CAD and USD/MXN could continue to face buying pressure over the medium term.

What path will central banks follow?
At the time of writing, North American central banks are beginning to show some divergence in their monetary policy outlook, as they have moved away from a path of lower interest rates toward a more stable, hold-driven stance. Bank of Mexico stands out, maintaining the highest rate in the region at 6.75% and largely keeping policy unchanged since December 2025, when rates were reduced from 7.25%. As a result, a central bank that was once more flexible has now aligned with its peers, adopting a more conservative stance in recent months.
Bank of Canada has now spent five months under a similar approach, stepping away from the rate cuts seen in late-2025. Since October of that year, the policy rate has remained at 2.25%, placing it in a relatively stable environment where, for now, no significant changes are expected to alter the current policy outlook.
Federal Reserve has also surprised markets by signaling a pause in rate cuts, after lowering rates to 3.75% from 4.00% in its December 2025 decision. While a new easing cycle had been expected following a period of stability throughout much of 2025, the current outlook points more toward a hold scenario, reflecting a more cautious stance from the central bank. In this context, the Fed appears to be aligning with its regional peers, reinforcing a more prudent approach to monetary policy.
North America Interest Rate Table 2025–2026
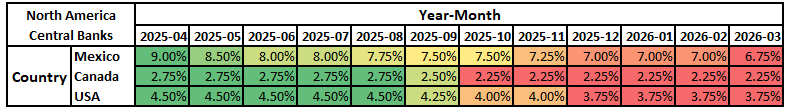
Colors: From green to red. Green indicates higher interest rates, while red represents lower rates in each country.
Source: Data - Tradingeconomics
North America Interest Rate Chart 2025–2026
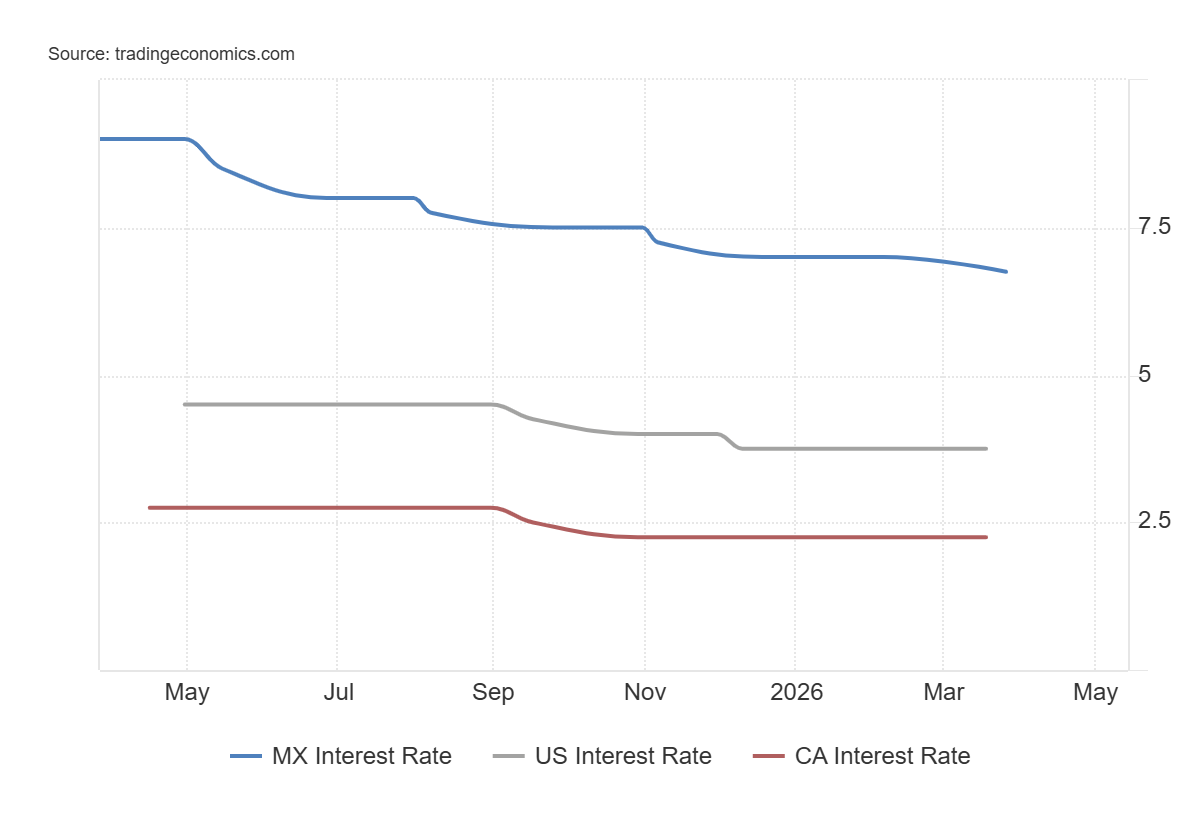
Source: Tradingeconomics
The key question is what path North American central banks will follow for the remainder of 2026, as this factor could prove decisive for the performance of their currencies in the coming trading months:
- On March 18, 2026, Bank of Canada kept rates unchanged at 2.25% and noted that, although inflation has moderated, external risks remain. For now, it maintains a wait-and-see approach amid mixed signals in economic activity.
- On March 26, the Bank of Mexico moved away from its hold policy and cut the interest rate to 6.75%. However, the board remains divided over potential inflation pressures, which does not confirm that this rate-cutting path can be sustained consistently.
- On March 18, Federal Reserve also kept interest rates unchanged at 3.75%, marking its second consecutive hold. The decision reflected rising inflation pressures and a lower urgency for rate cuts, pushing expectations out toward 2027 and reinforcing a stable outlook for 2026.
It is important to note that inflationary pressures have once again become a key focus for central banks, making it essential to assess how recent inflation data may influence or confirm the outlook for their upcoming policy decisions.
In Canada, inflation declined to 1.8% in February from 2.3% in January, slightly below the 2.00% target. In Mexico, a recent uptick stands out, with inflation rising to 4.02% in February, above 3.79% in January and the 3.00% target. In United States, inflation has remained stable at 2.4% year-over-year for January and February 2026, slightly above the 2.00% target.
North America Inflation Trend 2025–2026
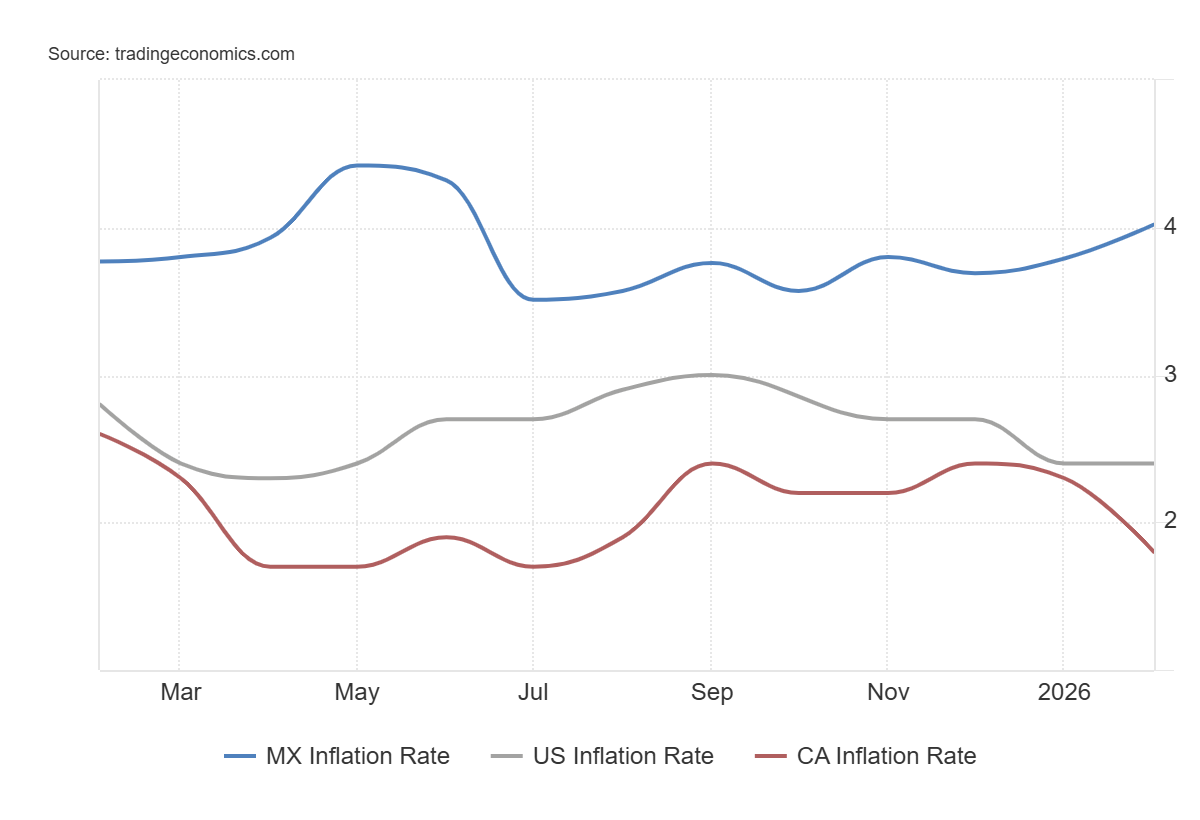
Source: Tradingeconomics
Inflation data is showing a mixed pattern, with Mexico and the United States drifting away from their targets, while Canada maintains a more controlled rate within the region. In the case of Federal Reserve and Bank of Mexico, this could limit further rate cuts, as both have emphasized the need to keep inflation under control. Although there may be more room for Bank of Canada to adjust policy, it is still maintaining a cautious stance due to ongoing external risks that could generate additional inflationary pressures in the coming months.
This environment suggests that monetary policy across the three central banks is likely to remain largely in a hold or stable stance over the coming months. Federal Reserve stands out, as only weeks ago markets expected rate cuts to begin in June 2026, but expectations have now shifted toward 2027, reflecting a more restrictive stance relative to its peers and reducing the likelihood of lower rates in the near term.
Overall, shifts in central bank policy could reshape the strength of North American currencies. Mexico continues to hold the highest interest rate in the region, which helps support the peso’s appeal in a relatively lower-rate global environment; if rates remain near 7.00%, demand for the peso could hold up against its peers, given the relative attractiveness of peso-denominated investments. However, it is important to note that risk perception in Mexico remains elevated, which could limit a sustained recovery.
In Canada, inflation concerns are supporting a more stable policy stance, but its rate remains the lowest in the region, reducing the relative appeal of Canadian dollar–denominated assets compared to alternatives such as the Mexican peso or the U.S. dollar. In contrast, the more cautious stance of the Federal Reserve continues to support the strength of U.S. dollar–denominated assets, as both the bond market and the dollar itself remain global safe-haven benchmarks. Additionally, stable rates and a more aggressive stance relative to its peers help reinforce the dollar’s attractiveness over time.
This scenario suggests that, unlike Mexico and Canada, the U.S. dollar could continue to show a meaningful recovery, as seen at the start of 2026. Over time, this could translate into sustained buying pressure or a stable environment in both USD/MXN and USD/CAD over the medium term.
The big surprise: Middle East conflict
The course of 2026 has been shaped by one of the most significant geopolitical events in recent years. Since February 28, 2026, tensions in the Middle East have escalated, with Israel and the United States confronting Iran. Following the fall of Iran’s supreme leader, a counterattack was launched, including missile strikes targeting areas near Israel and U.S. bases.
The conflict escalated further, impacting activity in the Strait of Hormuz between March 9 and 12, reaching peak tension with a nearly 90% drop in traffic. Market reaction was immediate: a surge in risk perception, increased demand for safe-haven assets, and a rise in energy prices, with WTI crude approaching the $120 level.
At the time of writing, the situation remains an active conflict with no clear short-term resolution, keeping risk sentiment elevated across major financial markets.
In this context, the U.S. dollar has gained relevance, as since the start of the Middle East conflict it has increasingly been perceived as a temporary safe-haven currency, offering stability and liquidity. In fact, the DXY index, which measures the dollar’s strength against other currencies, moved above the 97 level at the onset of the conflict, later surpassed 99 as disruptions in the Strait of Hormuz intensified, and eventually broke above the 100 psychological level amid continued escalation. This highlights that the dollar has been one of the currencies attracting the strongest demand as the conflict has persisted.
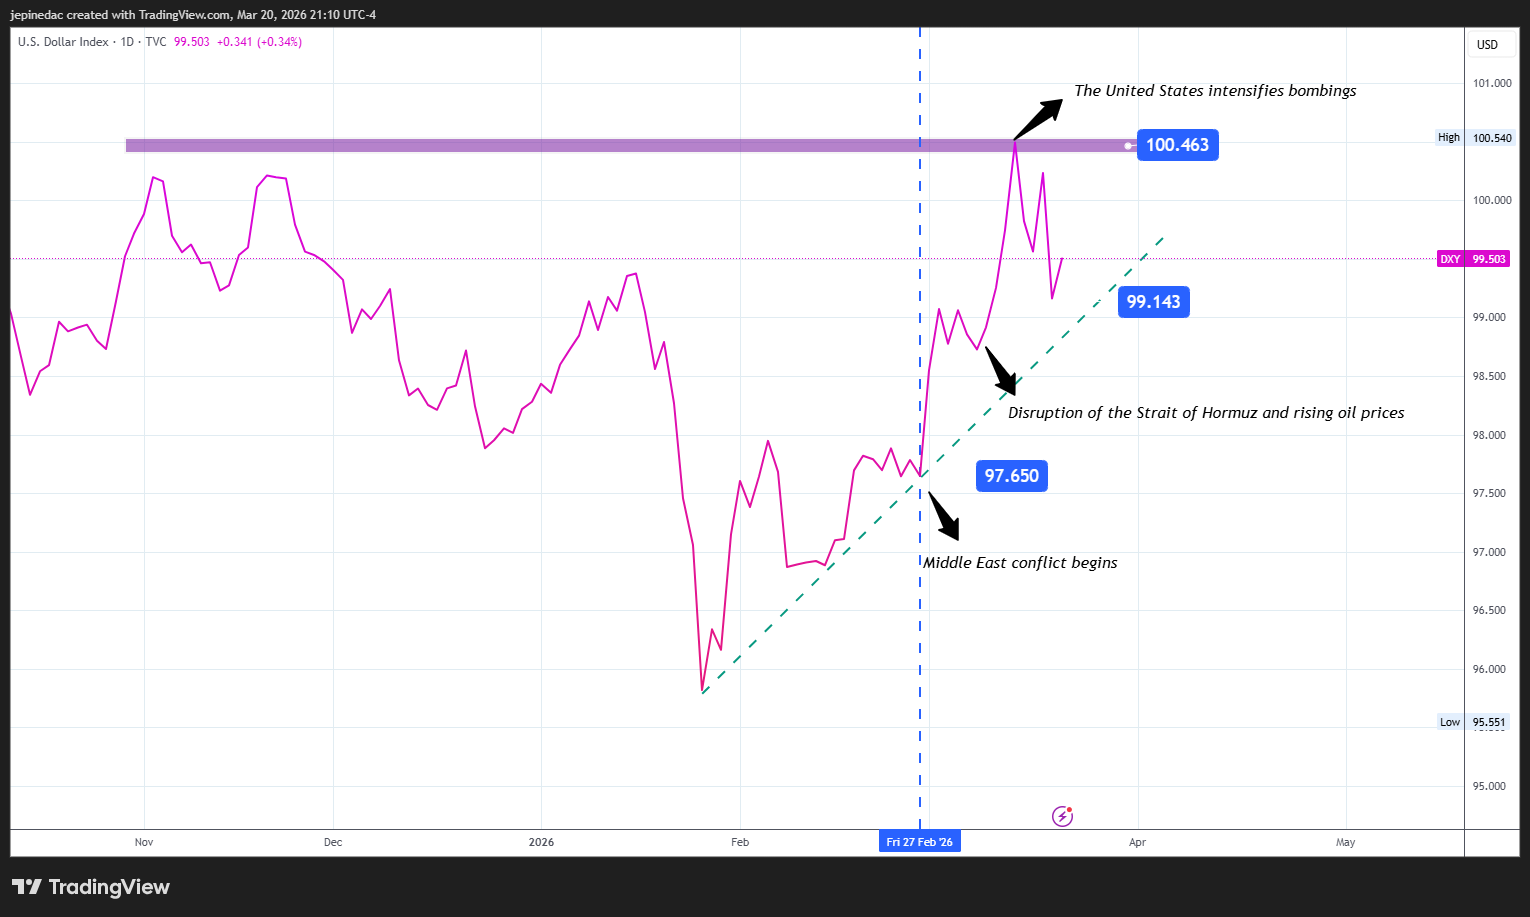
Source: Data TVC - Tradingview
The conflict has begun to generate additional inflationary pressures through rising energy prices, increasing production costs at a global level. This environment has led central banks to adopt a more cautious stance, while the U.S. dollar has regained prominence as a safe-haven currency, gaining ground against currencies such as the Canadian dollar and the Mexican peso.
In this context, if no clear short-term resolution emerges, demand for the U.S. dollar is likely to remain firm, potentially translating into sustained buying pressure in USD/MXN and USD/CAD over the coming months.
USD/CAD attempts to hold its downtrend
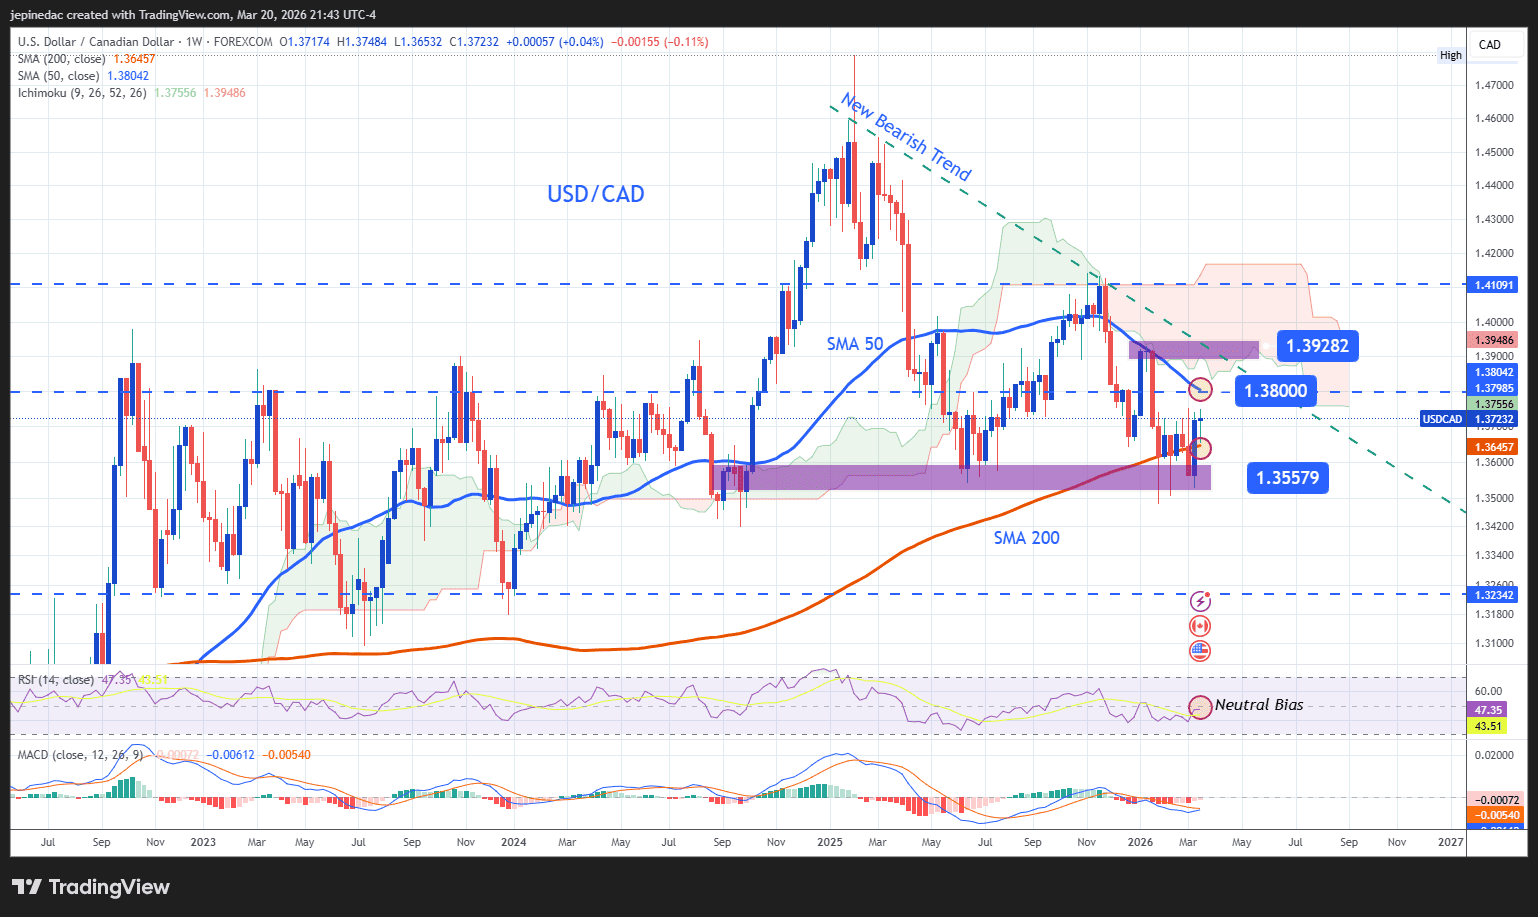
Source: StoneX, Tradingview
- New downtrend attempts to hold: Since the highs of February 2025, price action has shown a pattern of lower highs, leading to the formation of a potential downward trendline on the weekly USD/CAD chart. Although this structure has held in recent weeks, a neutral bias has started to emerge, with no new meaningful lows being formed. This may point to a more consistent phase of indecision; if selling pressure fades, the downtrend could give way to a sideways range in the coming months or even shift toward a more dominant bullish bias.
- Indicators:
- RSI: The RSI indicator continues to trade near the 50 midline, signaling a balance between buying and selling pressure over the past 14 weeks. This points to a lack of a dominant directional move, and if this dynamic persists, a more pronounced phase of indecision could develop in price action.
- MACD: A similar picture can be seen in the MACD, which remains close to the zero line, suggesting that medium-term moving average momentum is in balance. This dynamic could also reinforce a potential phase of indecision in price action.
- RSI: The RSI indicator continues to trade near the 50 midline, signaling a balance between buying and selling pressure over the past 14 weeks. This points to a lack of a dominant directional move, and if this dynamic persists, a more pronounced phase of indecision could develop in price action.
- Key Levels:
- 1.39282: Key resistance located in a zone of recent highs, positioned above the potential downtrend line. Price action approaching this level could trigger a bullish bias, potentially breaking the current bearish structure and paving the way for a more meaningful uptrend in the coming months.
- 1.38000: A near-term barrier aligned with a round-number psychological level and the 50-period simple moving average. It represents a key area of neutrality on the chart, and price action that fails to move decisively away from this level could lead to a phase of indecision and the formation of a sideways range in the coming months.
- 1.35579: Key support located near the lows of the downtrend line, representing the main downside barrier on the chart. A break below this level could lead to a new low, confirming selling pressure and extending the bearish trend over the medium term.
- 1.39282: Key resistance located in a zone of recent highs, positioned above the potential downtrend line. Price action approaching this level could trigger a bullish bias, potentially breaking the current bearish structure and paving the way for a more meaningful uptrend in the coming months.
USD/MXN begins to show a relevant bullish bias
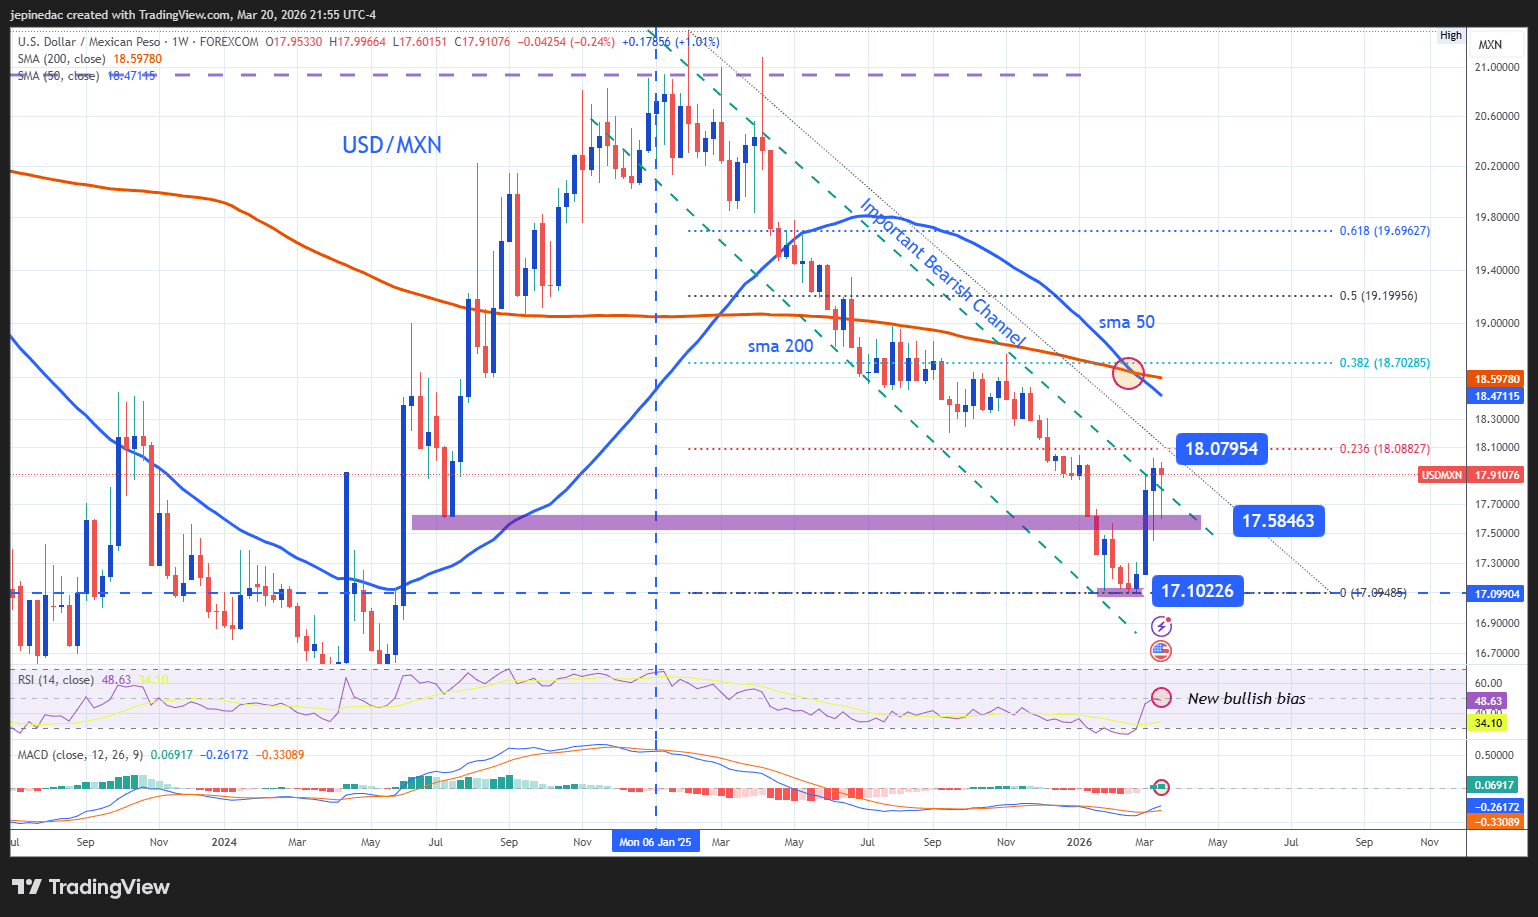
Source: StoneX, Tradingview
- Downtrend channel at risk: Since early January 2025, USD/MXN has maintained a consistent downward channel, which intensified in April as price action continued to print lower lows, reflecting the dominance of the Mexican peso. A bearish signal was also confirmed when the 50-period moving average crossed below the 200-period moving average. However, in recent weeks, the strength of the U.S. dollar has gained traction, and the rebound in USD/MXN has begun to test the lower channel structure. If buying pressure persists, this could lead to a structural shift, opening the door to a more relevant bullish bias in the coming months.
- Indicators:
- RSI: The RSI has started to move higher toward the 50 midpoint, and while it does not yet signal clear bullish dominance, it suggests that downside pressure is easing. If this trend continues, buying pressure could begin to build, becoming more relevant in price action.
- MACD: The MACD, for its part, is starting to move slightly above the zero line, suggesting that medium-term momentum is shifting into bullish territory. If this behavior holds, it could support a more meaningful buildup in buying pressure in USD/MXN over the coming months.
- RSI: The RSI has started to move higher toward the 50 midpoint, and while it does not yet signal clear bullish dominance, it suggests that downside pressure is easing. If this trend continues, buying pressure could begin to build, becoming more relevant in price action.
- Key Levels:
- 18.07: Crucial resistance located at the 23.6% Fibonacci retracement level, marking the key barrier above the prevailing bearish structure. Sustained price action above this level could trigger a dominant bullish bias over the coming months.
- 17.58: This level represents a near-term price barrier that has historically acted as a zone of neutrality. Price action holding close to this area could signal a more sustained phase of indecision, potentially leading to a period of consolidation and the formation of a sideways range on the chart.
- 17.10: The final support zone aligns with levels not seen since June 2024 and acts as the main downside barrier. Sustained moves toward this area could keep a dominant bearish bias in place and extend the formation of the downward channel over the coming months.
- 18.07: Crucial resistance located at the 23.6% Fibonacci retracement level, marking the key barrier above the prevailing bearish structure. Sustained price action above this level could trigger a dominant bullish bias over the coming months.
Written by Julian Pineda, CFA, CMT – Market Analyst
Follow him on: @julianpineda25