
Hormuz deadline and US CPI risks continue to dominate market sentiment, keeping dollar pairs, commodities, and equities highly reactive. Key scenarios include bullish breakout risks across crude oil and the US Dollar Index (DXY), as both hold near critical resistance levels ahead of the 8 PM Eastern Time deadline set by President Trump for Iran to reopen the Strait of Hormuz and agree to negotiations within a ceasefire framework.
This geopolitical tension is keeping markets tilted toward caution. The persistence of crude oil prices near the $100 threshold—now entering the sixth week of the conflict—is intensifying global inflationary pressures. These pressures are increasingly reflected in key data, including eurozone inflation metrics, which have risen back above the European Central Bank’s 2% target.
The US CPI Release on Friday is a Key Event Risk
The US CPI release on Friday is a key event risk, with bullish expectations driven by severe energy supply disruptions caused by strikes on key facilities and blockages in critical supply routes, particularly through the Strait of Hormuz. This backdrop is keeping dollar pairs supported.
Should de-escalation materialize, the CPI reading may carry less significance, as market expectations would shift toward easing inflation pressures. Conversely, continued disruptions and rising inflation metrics could drive another leg higher in dollar pairs, while weighing further on global currencies and precious metals.
Key Charts and Levels to Watch
- DXY: a close above 100.60 could extend downside pressure across currencies and precious metals, while a move below 98 may support rebounds across FX and metals
- Crude oil: holding above the 118 level would extend upside risks toward the 130–150 range, intensifying pressure on the global economy. A move back below 88 would signal initial easing
USDCAD Price Forecast: Monthly Time Frame - Log Scale
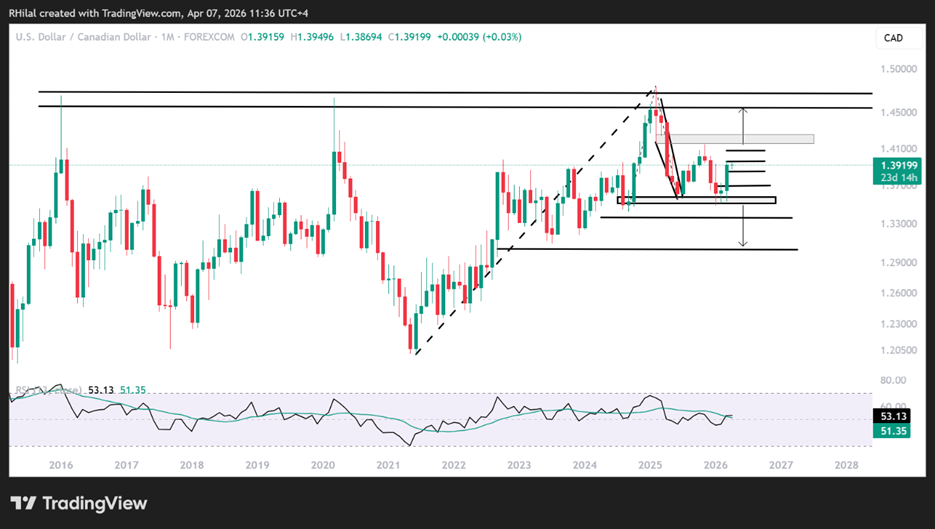
Source: Trading view
From a monthly perspective, USDCAD remains in a corrective phase following the June 2021–February 2025 uptrend, while holding above the 1.35 support level. With the DXY maintaining bullish positioning, USDCAD is trading below the 1.40 threshold at the time of writing, outlining two key scenarios:
Bullish Scenario:
A close above 1.3950 exposes the 1.4070 and 1.4150 (November 2025 high) levels for another resistance test. A sustained break above these levels could open the door for a return to decade highs near 1.45.
Bearish Scenario:
A close below 1.3850 exposes the 1.3690 and 1.35 support levels for a potential rebound test. A break below 1.35 would extend bearish forecasts toward 1.3360 and 1.30.
USDJPY Price Forecast: Weekly Time Frame - Log Scale
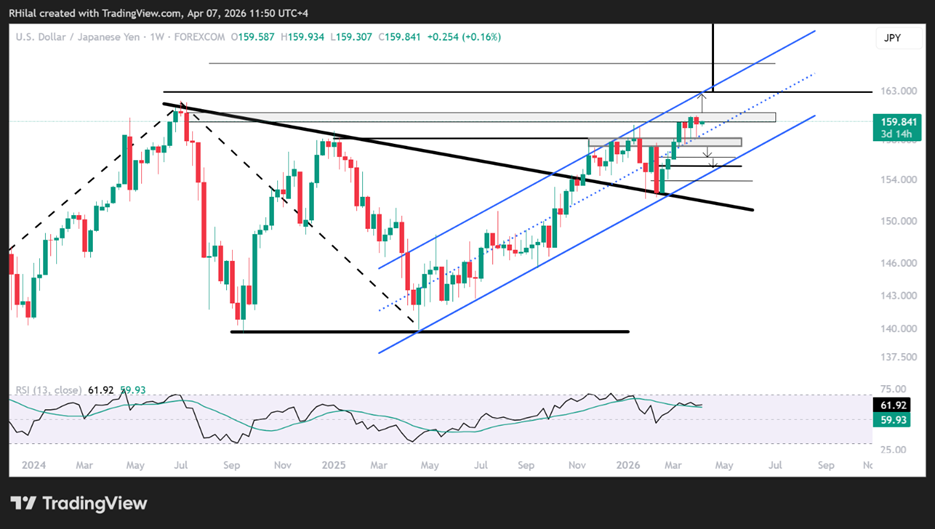
Source: Trading view
From a weekly perspective, the USDJPY chart maintains a bullish bias above the bounds of a consolidation that has been extending since December 2023, within the bounds of an up trending channel from the lows of April 2025 (in blue).
Bullish Scenario:
A close above the 160 mark extends bullish forecasts towards the upper bound of the channel near 160.80, 162, and 164 respectively. A further bullish close above 164 could confirm a breakout from the consolidation, with a measured move equivalent to its height, targeting the 170 level, as outlined in the monthly outlook.
Bearish Scenario:
A close below the 158 and 157.50-157.30 zone, which represents the mid zone of the channel, exposes the pair to further drawdowns towards 156.20, 155.30, and 153.80, the lower bound of the channel, for a potential bullish recovery, or a deeper pullback towards the 150 and 147 levels.
The upside potential highlighted in the bullish scenario can be further mapped on the 3-month time frame.
USDJPY Price Forecast: 3 Month Time Frame - Log Scale
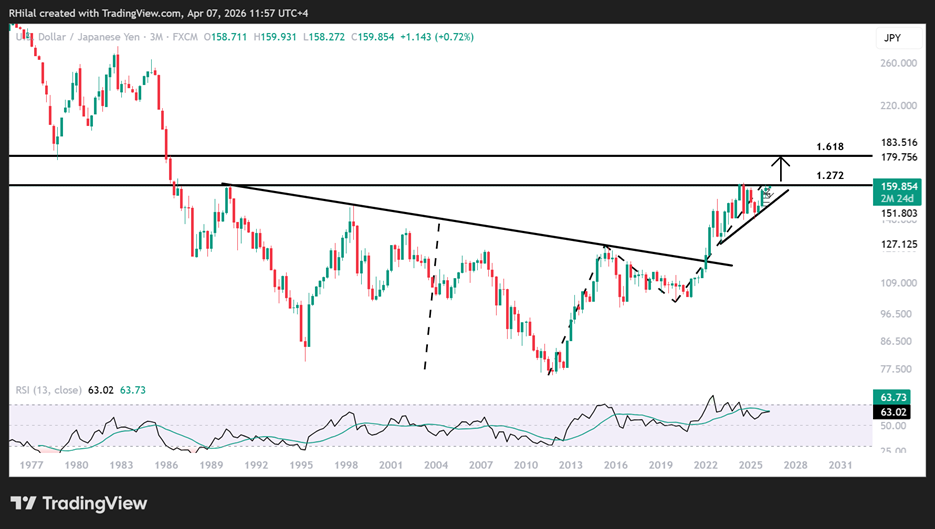
Source: Trading view
From a 3-month perspective, the bullish bias remains capped below the 1990 highs and the 1.272 Fibonacci extension of the move spanning the 2011 lows, 2015 highs, and 2020 lows, around the 160 level. A close above 164 would mark a break above the 1986 highs, exposing further upside towards the 180 zone, last seen in 1978, aligning with the 1.618 Fibonacci extension level.
As previously highlighted, risks of BOJ currency intervention remain elevated, keeping long-term key levels in focus to confirm the next structural shift in the pair.
Written by Razan Hilal, CMT
Follow on X: @Rh_waves