

As the trading week comes to a close, USD/MXN price action has posted a four-session bearish streak, with a decline of more than 2.7% in the short term in favor of the Mexican peso, giving way to a more consistent bearish bias in recent movements.
For now, selling pressure has started to emerge due to both the weakness of the U.S. dollar and the latest inflation data in Mexico, which do not show a clear slowdown and reinforce the possibility of a more aggressive stance from Banco de México. In this context, USD/MXN weakness could remain relevant in the coming trading sessions.

New inflation data in Mexico
During today’s session, Mexico’s annual inflation rate was released, coming in at 4.59% for March, in line with expectations of 4.6%, but still well above the central bank’s target near 3.00%.
Although the figure matched expectations, what stands out is that inflation has shown a consistent upward trend in recent months, rising from around 3.69% in December to current levels. This reflects a continued divergence from the central bank’s target, suggesting that the current policy approach may require adjustments to maintain price stability in the coming months.
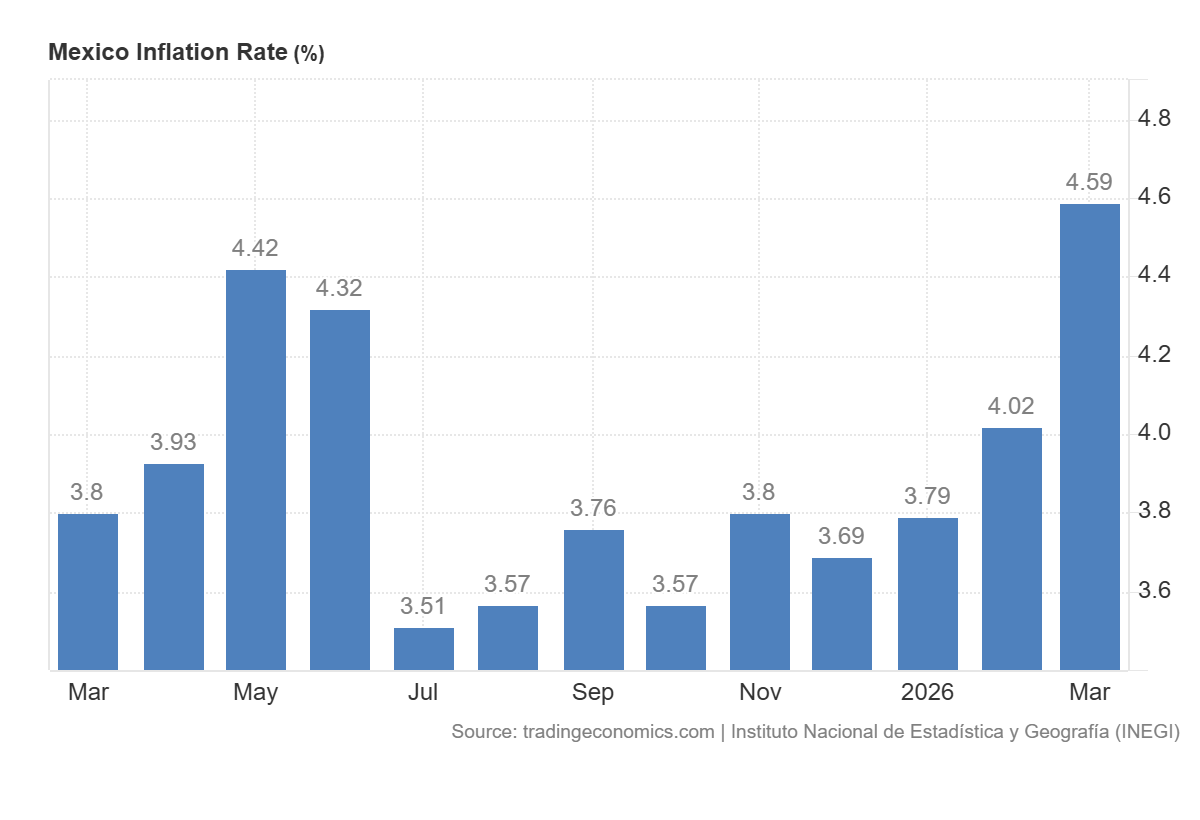
Source: TradingEconomics
This context is particularly relevant, as during its March decision Banco de México cut interest rates to 6.75%, with a divided board awaiting further inflation data. Now, with inflation remaining elevated, this could begin to influence the central bank’s outlook for upcoming monetary policy decisions in 2026, potentially leading to a pause in rate cuts in the coming months.
Considering that Banco de México maintains one of the highest interest rates compared to economies such as Canada or the United States, a more aggressive stance could continue to support the attractiveness of peso-denominated assets. As a result, if inflation pressures persist, selling pressure on USD/MXN could remain relevant in the weeks ahead.
Temporary relief for the U.S. dollar?
It is also worth noting that the recent strength of the Mexican peso has been supported by the weakness of the U.S. dollar, driven by the truce in the Middle East, which has reduced demand for safe-haven assets such as the dollar.
The DXY index, which measures the strength of the dollar against its major peers, has shown a decline from the 100 level toward levels below 99, reflecting weaker demand for the currency in the short term.
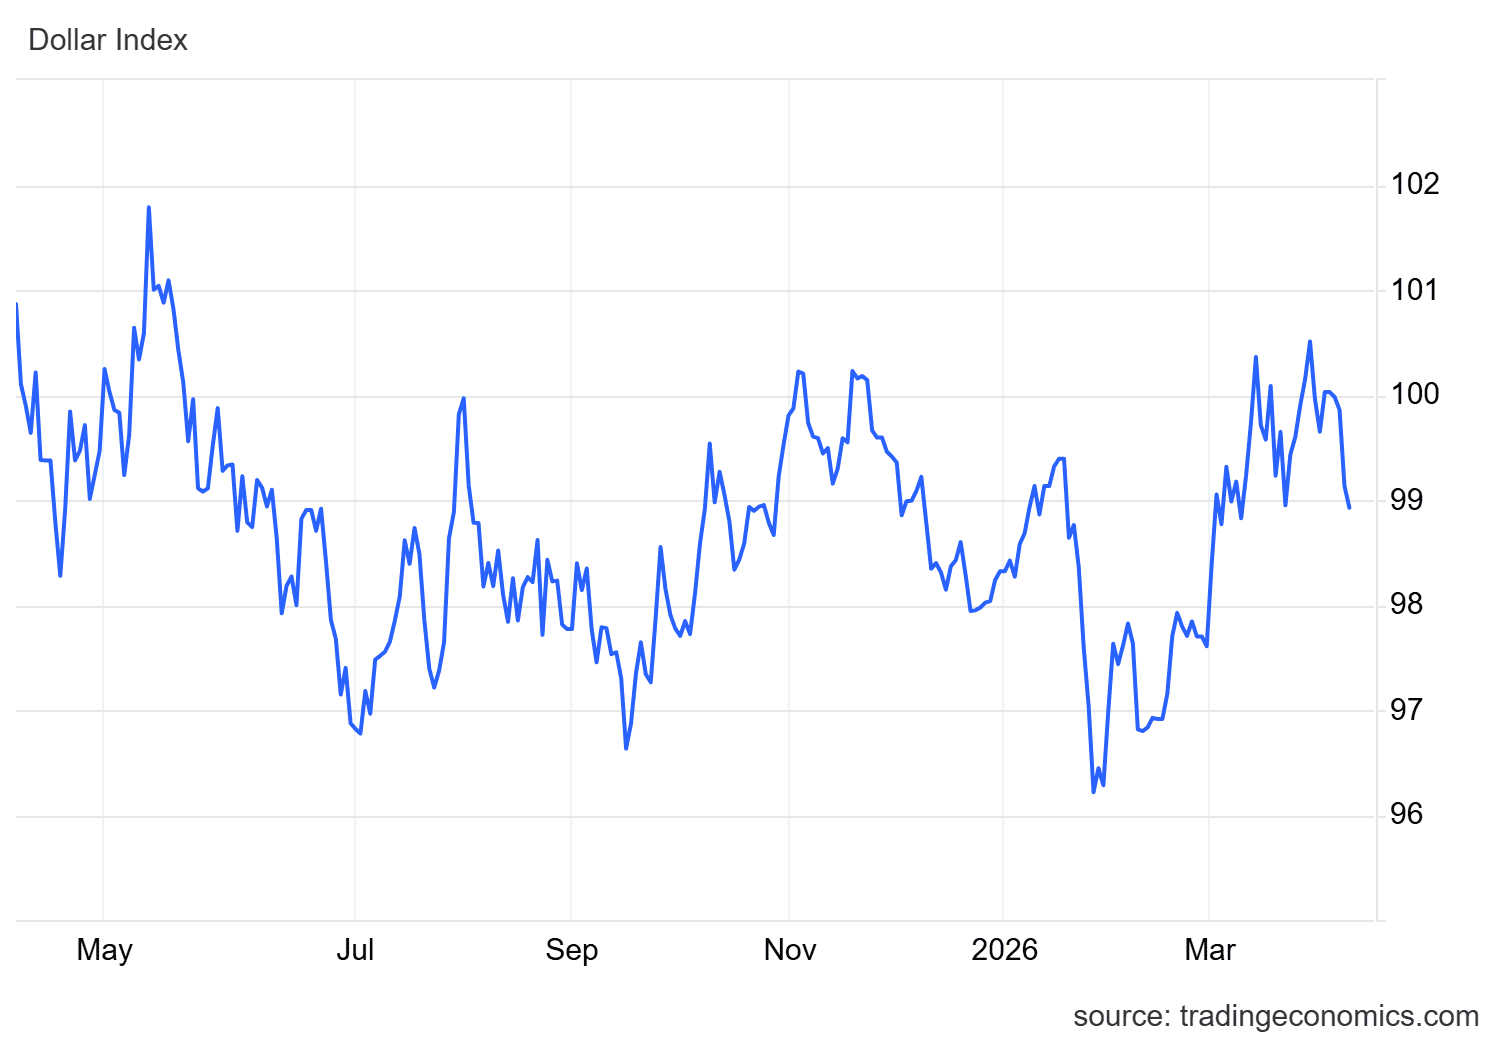
Source: TradingEconomics
In this context, if dollar weakness persists, the peso could continue to gain ground in the short term, further supporting downside pressure in USD/MXN. However, it is important to consider that any renewed escalation in the Middle East conflict could reverse this dynamic and restore demand for the dollar, as seen in previous weeks.
USD/MXN Technical Outlook
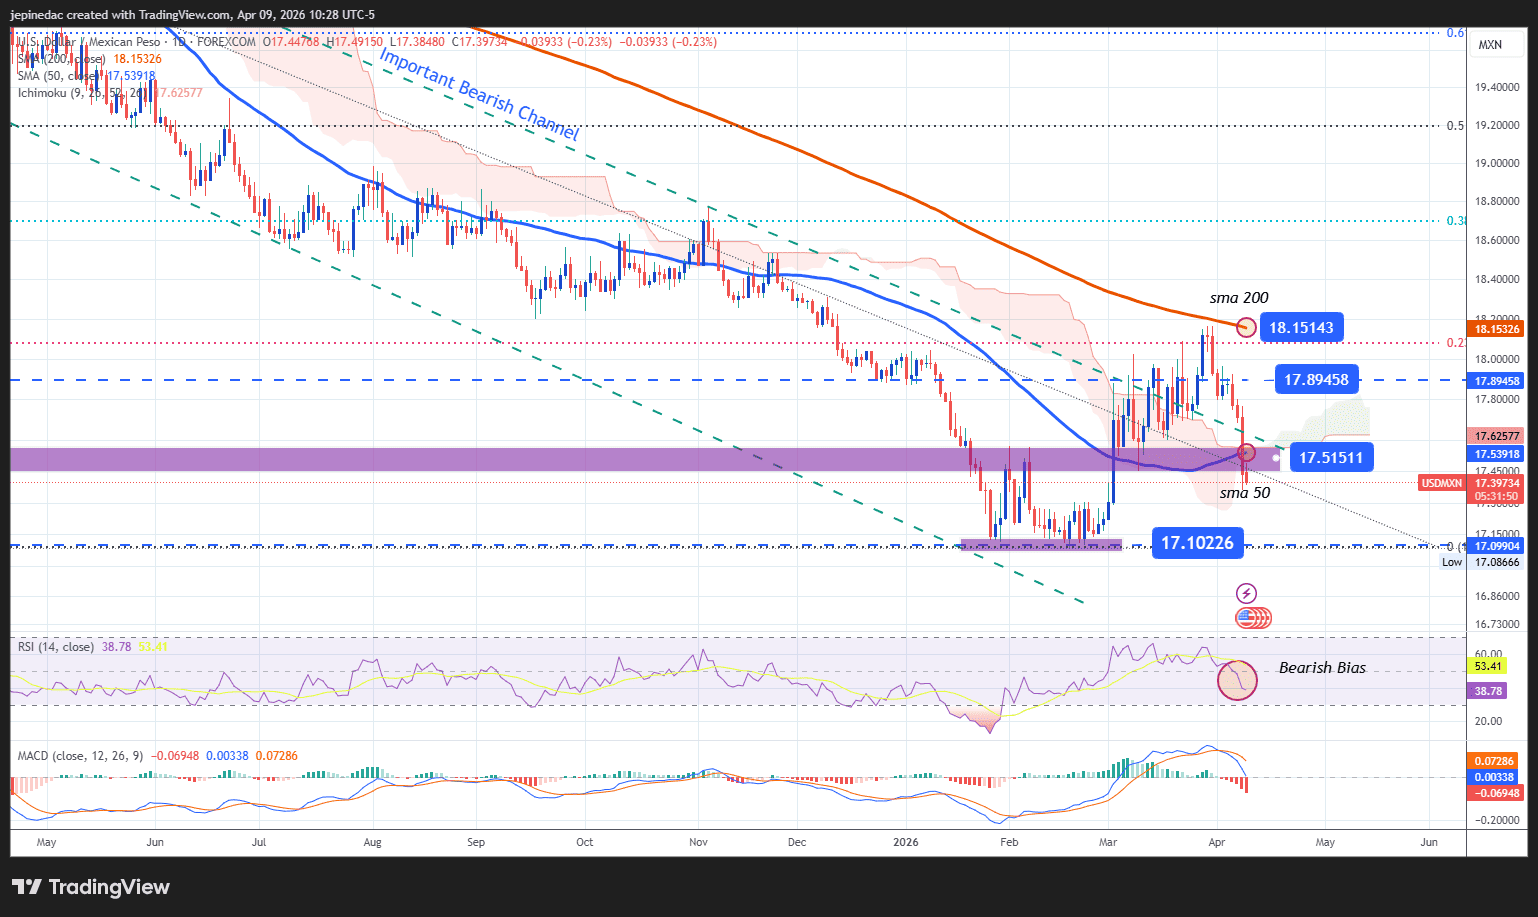
Source: StoneX, Tradingview
- Long-term bearish channel regains dominance: The recent weakness in USD/MXN has allowed the long-term bearish channel, in place since 2025, to regain relevance in the short term and once again stand out as the most important technical structure. As long as buying pressure fails to consolidate, the dominant bias is likely to remain bearish, as recent upward corrections have not been strong enough to challenge this structure. Therefore, in the coming sessions, the chart bias continues to lean toward the downside.
- RSI: The RSI shows a consistent move below the 50 level, suggesting that selling momentum dominates over the last 14 sessions. As long as this dynamic persists, downside pressure could continue to strengthen.
- MACD: The MACD histogram also remains below the zero line, reflecting that selling pressure continues to dominate short-term moving averages. If this behavior continues, it could reinforce a bearish bias in the coming sessions.
Key levels:
- 17.89 – Key resistance: A previous high located above the bearish channel. A move toward this level could reactivate a bullish bias and challenge the current bearish structure.
- 17.51 – Current barrier: A near-term level aligned with the 50-period moving average. This level could act as a reference point for potential short-term corrective moves.
- 17.10 – Key support: A level corresponding to 2026 lows and the main downside barrier. A break below this level could reinforce stronger selling pressure and extend the bearish channel in the coming weeks.
Written by Julian Pineda, CFA, CMT – Market Analyst
Follow him on: @julianpineda25