
Wall Street futures are entering a shortened trading week ahead of the July 4th holiday. While the Nasdaq 100 and S&P 500 may have already delivered the lion’s share of recent gains, the Dow Jones appears to be catching up with renewed momentum. This technical outlook breaks down the latest price action across key US indices — including potential breakout levels and support zones to watch.
View related analysis:
- Nasdaq 100, S&P 500: Seasonality Analysis For July
- Nasdaq 100, ASX 200 Outlook: Nasdaq Hits Fresh Highs As Fed Cut Bets Grow
- ASX 200 Bulls Eye Fresh Record Highs, But Pullback Risks Linger
- ASX 200, Hang Seng, Nikkei 225 Futures: Bull Rallies Face Resistance
Wall Street Index Futures: Nasdaq 100, S&P 500 and Dow Jones Analysis
With the US Independence Day holiday approaching, Wall Street is heading into a shortened trading week. Following strong rallies across key indices, the Nasdaq 100 and S&P 500 may have already delivered the bulk of their gains — at least for now. In contrast, the Dow Jones appears to be staging a late-cycle catch-up rally, adding a twist to market dynamics as the week progresses.

Nasdaq 100 Futures (NQ) Technical Analysis
The tech-heavy Nasdaq 100 has been the standout performer among Wall Street indices, with futures rallying 37.5% from the April low to this week’s high. However, the index snapped a six-day winning streak by Tuesday’s cash close, suggesting some profit-taking may be underway. Notably, Monday’s record high was only marginally above December’s peak, and prices have since slipped below the February high.
This sets the stage for potential sideways consolidation or a minor pullback. Traders should remain cautious of false breakouts — particularly while the S&P 500 remains below its own all-time high. Near-term sentiment may become more mixed as holiday-thinned volumes take over.
Bulls may look for confirmation of a swing low near key Fibonacci retracement levels or around the June VPOC (volume point of control) slightly above the 22,000 mark. A rebound from this zone could signal renewed bullish momentum and set the stage for a breakout. In the broader view, the technical bias remains bullish, with an upside target near 25,000 — a projection based on the assumption that the recent runaway gap marks the midpoint of a larger upward move.

Chart analysis by Matt Simpson, Source: TradingView, CME Futures
S&P 500 Futures (ES) Technical Analysis
The daily chart shows a similar trend structure overall, though the S&P 500 trades beneath its record high set in December. Tuesday’s cash-market range also formed an inside day as opposed to a clear bearish day seen on the Nasdaq 100. Perhaps bulls want another crack at that record high.
Should we see a false break, I am on guard for a minor pullback. Though I remain confident that bulls will be eager to snap up a small discount an eye bullish trend continuation. Should the S&P 500 form a solid close above the 2024 high, it could be game on for Wall Street bulls – regardless of whether their weapon of choice is the S&P 500, Nasda1 100 or Dow Jones.
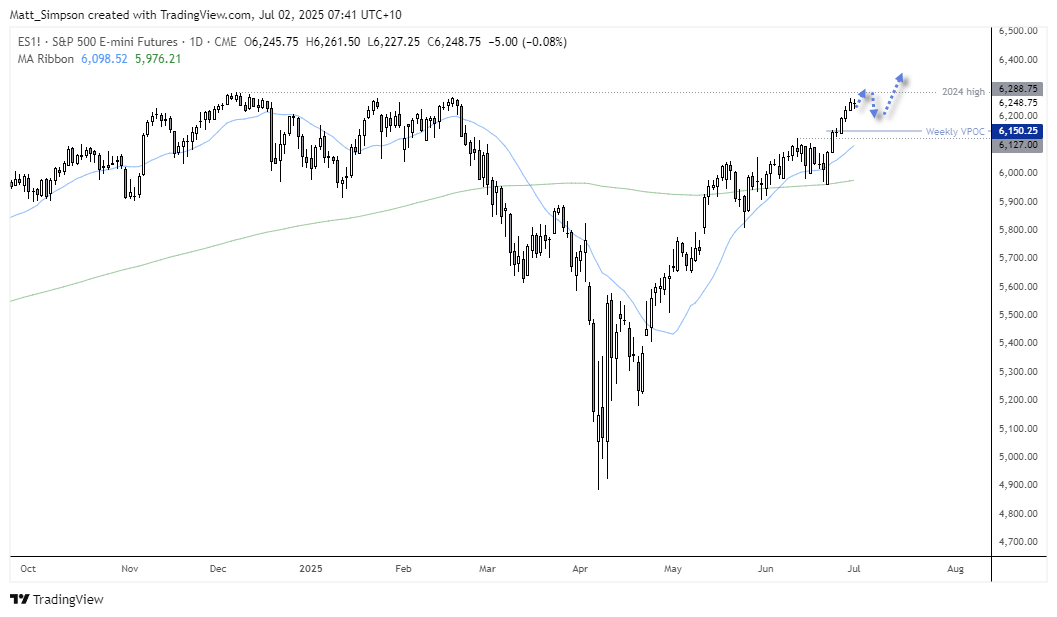
Chart analysis by Matt Simpson, Source: TradingView, CME Futures

Dow Jones Futures (YM) Technical Analysis
While the Nasdaq and S&P 500 have been the clear outperformer on Wall Street, the Down Jones is regaining bullish pace. And with little in the way of major resistance (such as prior record high), perhaps the Dow Jones will be the outperformer heading into the Independence Day celebrations.
45,000 seems within easy reach, with a weekly VPOC around 45,200 also making a potential target for bulls. A break above which brings the 46,00 into focus, near another weekly VPOC and just beneath its all-time high.
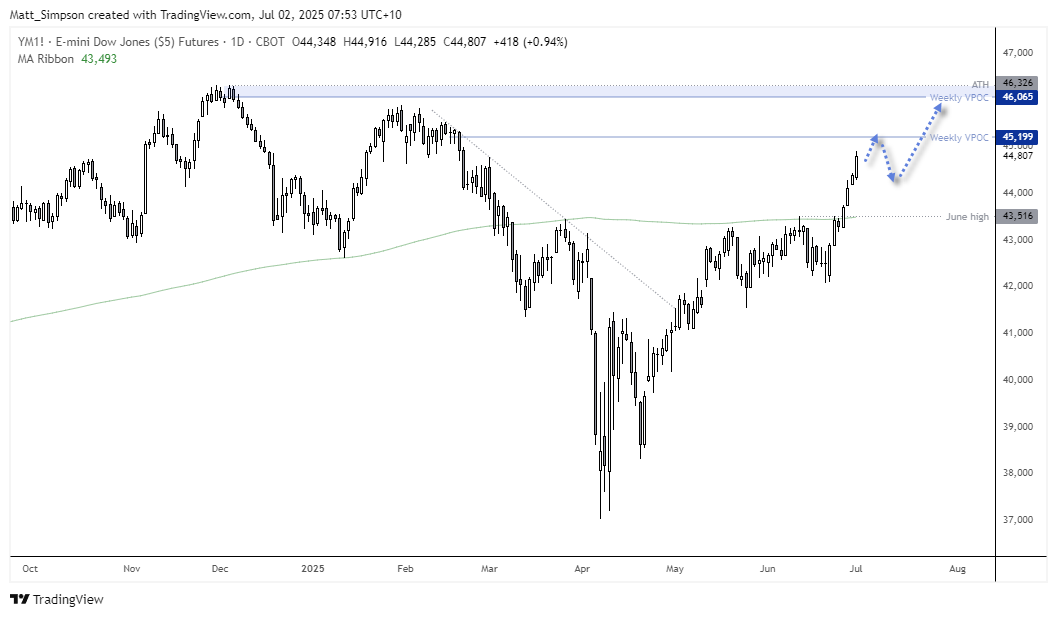
Chart analysis by Matt Simpson, Source: TradingView, CME Futures
View the full economic calendar
-- Written by Matt Simpson
Follow Matt on Twitter @cLeverEdge
How to trade with City Index
You can trade with City Index by following these four easy steps:
- Open an account, or log in if you’re already a customer
• Open an account in the UK
• Open an account in Australia
• Open an account in Singapore
- Search for the market you want to trade in our award-winning platform
- Choose your position and size, and your stop and limit levels
- Place the trade