WTI crude oil prices plunged in Asia on Wednesday as traders aggressively unwound geopolitical risk premium tied to Middle East tensions. The sharp move lower comes amid signs of easing conflict risks, triggering one of the most bearish sessions on record for oil prices.
With volatility surging and prices testing key technical levels, traders now face a critical question: has the bulk of the downside move already played out, or is there scope for a deeper retracement if sentiment continues to stabilise?
View related analysis:
- USD/JPY Outlook: US Dollar Stalls at 160 as Nikkei Eyes Gains
- AUD/USD Outlook: Trump Address Could Trigger Breakout or Breakdown
- AUD/USD Outlook 2026: Key Drivers for the Australian Dollar in Q2
WTI Crude Oil Plunges as Ceasefire Sparks Risk-On Rally
Crude oil prices plunged on Wednesday in Asia after President Trump effectively announced a two-week ceasefire with Iran. We’ve since heard that Iran and Netanyahu are on board, although Lebanon has been excluded for now. While it remains unclear how this will play out, it has provided short-term relief for markets and a decent boost to risk appetite.
Wall Street futures gapped higher, while the US dollar and crude oil prices moved notably lower. In fact, WTI crude is on track for its sixth most bearish day on record (since 1983), down around -14.5%. Its current high-to-low range sits at 16.6%, with prices having fallen as much as 19.2% at the session low.
There is a reasonable chance that downside may now be limited over the near term, as this appears to be the initial reaction to hopes the conflict is nearing an end. But ceasefires can fail and negotiations can break down. If that happens, the sharp downside move could quickly reverse into a bullish impulse for crude oil and inflation expectations.
Traders therefore need to stay focused on Middle East headlines, which retain the power to swing sentiment in either direction.
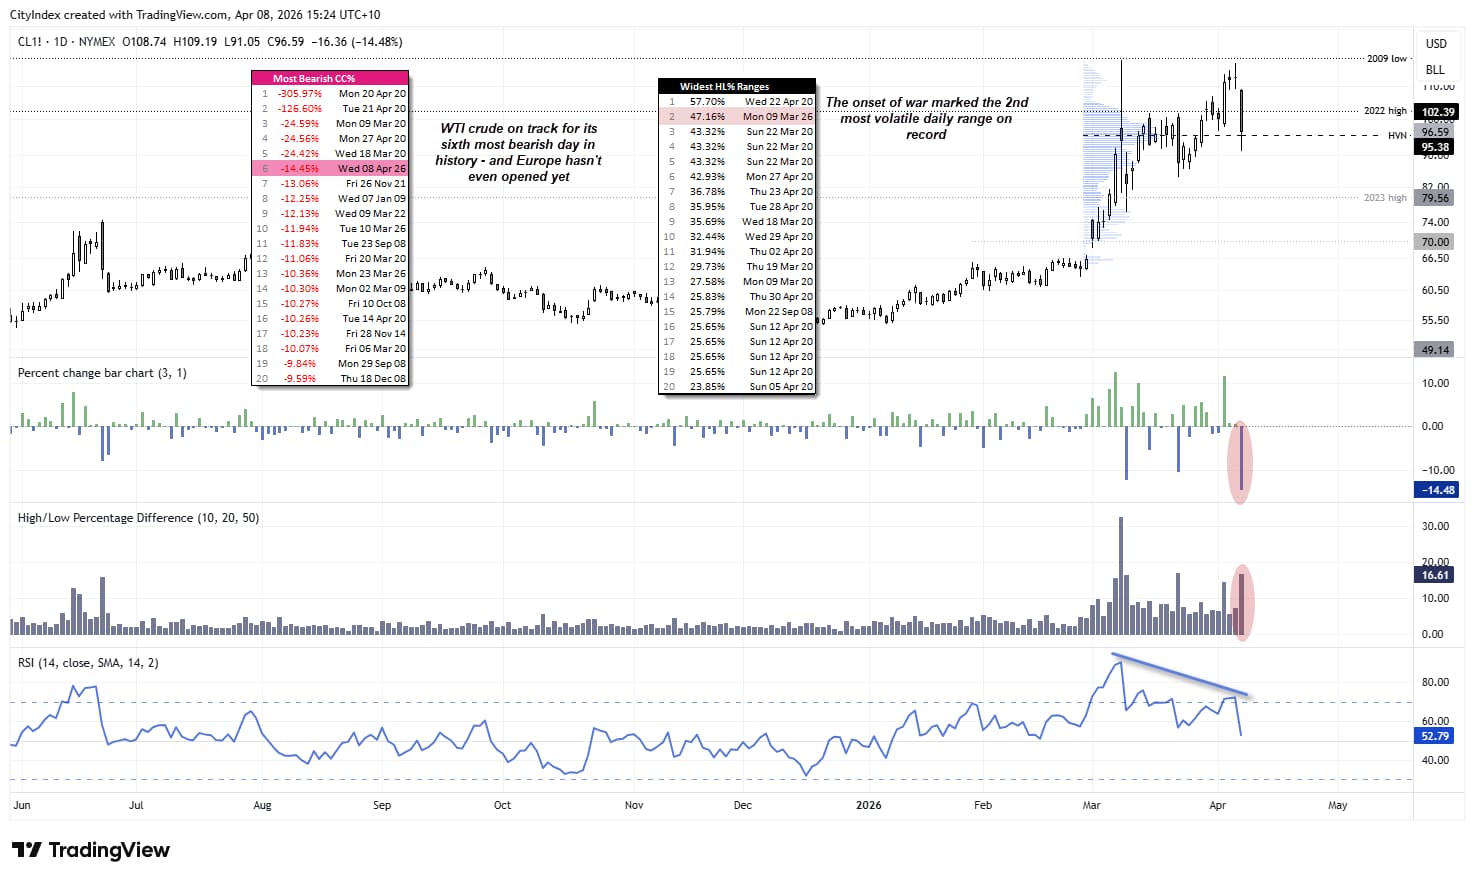
Source: NYMEX, TradingView
Bull vs Bear Case: What Comes Next for Crude Oil?
- The most bearish scenario for oil prices would be a full reopening of the Strait of Hormuz without adverse consequences for any region (such as the US or Europe)
- Conversely, the most bullish scenario is a breakdown in talks, the end of the ceasefire, and the US proceeding with previously threatened strikes on Iran
- That still leaves plenty of middle ground — Iran has demonstrated its ability to disrupt global oil supply, making it unlikely that the US can simply reverse course and return conditions to normal

WTI Crude Oil Futures (CL) Technical Analysis
Prices are hovering around the monthly pivot point and high-volume node (HVN) formed since the war began. We still need to see how Europe and the US react, so another wave of selling later in the day cannot be ruled out. That said, downside may be limited in the near term as traders look for clearer signals on whether talks are progressing.
Bulls may look to buy dips around the spike lows, targeting a move back towards $100 or the $102.40 region near the 2022 high and weekly pivot levels.
A break below $89 would suggest risk appetite is extending its rally and that talks are being perceived as constructive. That opens the door for a move towards $84.37 — and a break below there brings the $76–$79 zone into focus near the post-war low and 2023 high.
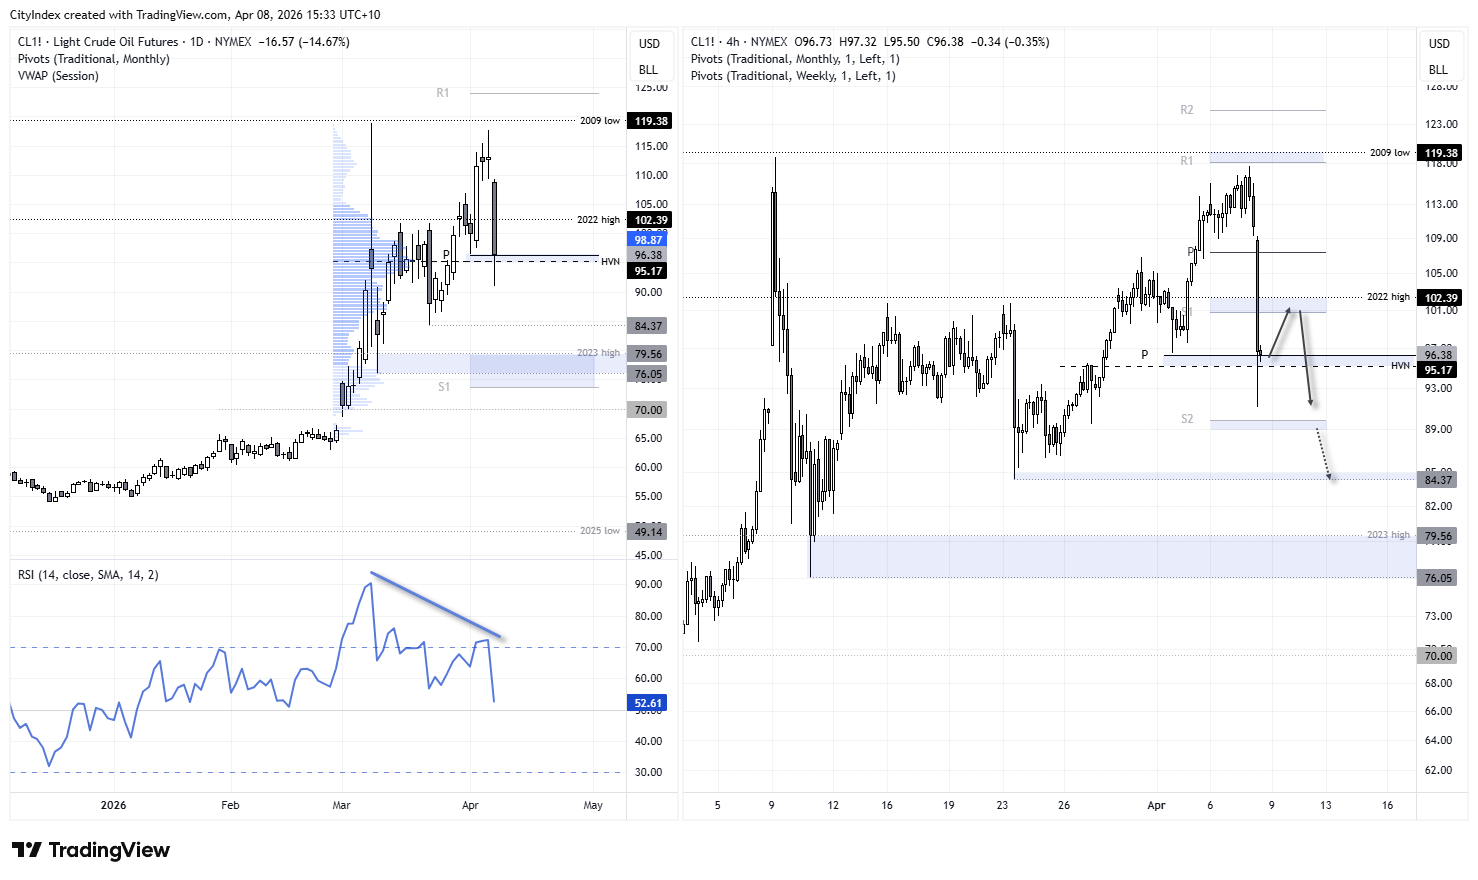
Source: NYMEX, TradingView
WTI Crude Oil Futures Positioning | COT Report
It appears large speculators anticipated a potential ceasefire, increasing short exposure while trimming longs — dragging net-long positioning lower for a second consecutive week. A similar pattern was also seen among asset managers in WTI crude oil futures.
If talks progress smoothly, we could see further long liquidation alongside fresh short positions as prices move lower.
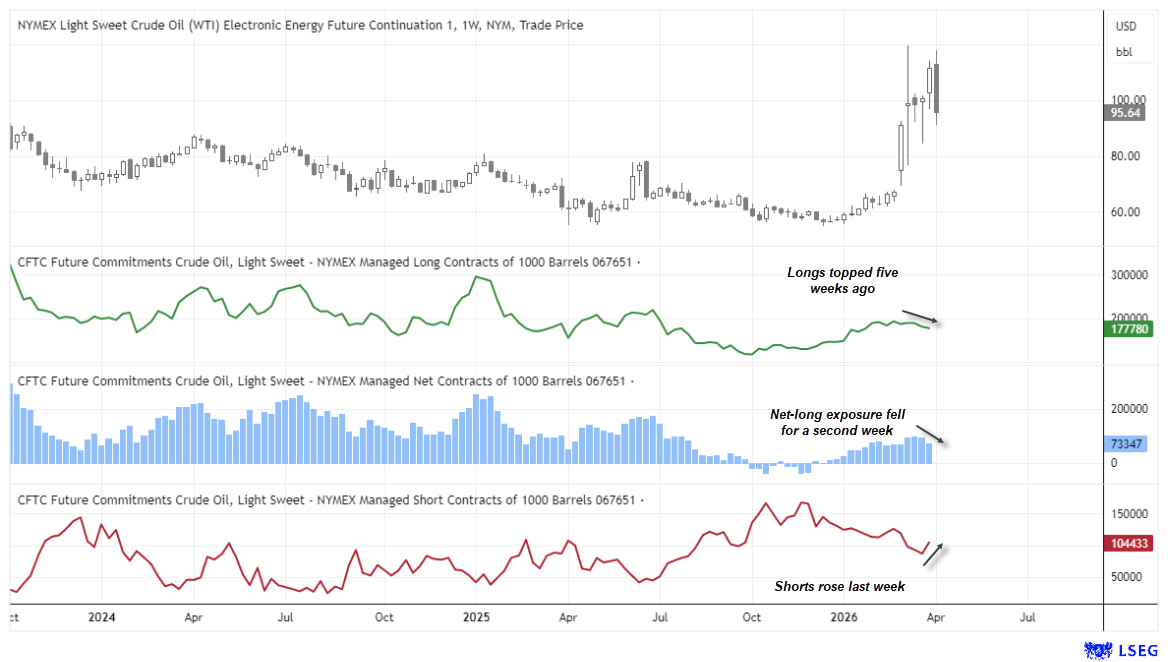
Source: NYMEX, LSEG
View the full economic calendar
-- Written by Matt Simpson
Follow Matt on Twitter @cLeverEdge
How to trade with City Index
You can trade with City Index by following these four easy steps:
- Open an account, or log in if you’re already a customer
• Open an account in the UK
• Open an account in Australia
• Open an account in Singapore
- Search for the market you want to trade in our award-winning platform
- Choose your position and size, and your stop and limit levels
- Place the trade